Calculus AB Homework 4.6: Relationship between f, f', and f''
TLDRThis video tutorial guides viewers through a series of calculus problems involving the analysis of a function's graph to determine the sign of its first and second derivatives at various points. It covers concepts such as concavity, inflection points, and the use of derivative tests to understand a function's behavior. The script also explores the implications of a function's derivatives on its graph, including increasing and decreasing intervals, and how to approximate function values using tangent lines.
Takeaways
- 🔍 Point A is above the x-axis, indicating that S(T) is positive at point A.
- 📈 S' at point A has a negative slope, indicating a decreasing trend.
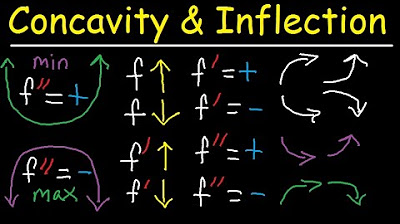
- 📉 S'' at point A is positive, indicating concave up at this point.
- ✅ All points (A, B, C, D, E) on S(T) are positive since they are above the x-axis.
- 0️⃣ Point B has a slope of 0, making S' at point B zero.
- ➕ S' at point C is positive, indicating an increasing trend.
- ➖ S'' at point D is negative, indicating concave down at this point.
- 🔄 Point C has a second derivative of 0, indicating a change in concavity (inflection point).
- 🔍 F' being less than 0 and F'' greater than 0 means the graph of F(X) is decreasing and concave up, respectively.
- 🔀 Inflection points in F are where F'' changes sign, and are at the relative maximums and minimums of F'.
Q & A
How is the sign of the function s(T) determined at different points on the graph?
-The sign of s(T) is determined by the position of the point relative to the x-axis. If the point is above the x-axis, s(T) is positive; if below, it is negative; and if it lies on the x-axis, s(T) is zero.
What does the slope of the graph at a point indicate in terms of s'(T)?
-The slope of the graph at a point indicates the value of s'(T), which is the first derivative of s(T). A positive slope means s'(T) is positive, a negative slope means s'(T) is negative, and a slope of zero indicates s'(T) is also zero at that point.
How can you determine if the second derivative s''(T) is positive, negative, or zero at a point?
-To determine s''(T), you look at the concavity of the graph at that point. If the graph is concave up, s''(T) is positive; if concave down, s''(T) is negative; and if the concavity is changing at that point, s''(T) is zero.
What does it mean for a function to be twice differentiable?
-A function being twice differentiable means that it has two derivatives, indicating that the function's first and second derivatives both exist.
How can you determine the number of relative maxima a function has by looking at its first derivative?
-A relative maximum occurs where the first derivative changes from positive to negative. By identifying where the graph of the first derivative crosses the x-axis from above to below, you can determine the number of relative maxima.
What is the relationship between the first derivative and the increasing or decreasing nature of a function?
-A function is increasing where its first derivative is positive and decreasing where its first derivative is negative.
How can you identify points of inflection on a graph?
-Points of inflection can be identified by looking for changes in concavity, which occur where the second derivative changes sign, or by looking for relative maxima and minima in the graph of the first derivative.
What is the equation of the normal line to the graph of a function at a given point?
-The equation of the normal line at a point is given by the formula y - y1 = m_normal * (x - x1), where m_normal is the slope of the normal line (the negative reciprocal of the tangent line's slope), and (x1, y1) is the point of tangency.
How can you determine whether a tangent line approximation is an over or under approximation?
-The type of approximation depends on the concavity of the graph at the point of tangency. If the graph is concave up, the tangent line is an under approximation; if concave down, it is an over approximation.
What does a sign change in the first derivative indicate about the function?
-A sign change in the first derivative indicates a potential relative maximum or minimum, as the function changes from increasing to decreasing or vice versa.
How can you determine the intervals where a function is increasing or decreasing?
-You can determine the intervals by analyzing the sign of the first derivative. The function is increasing where the first derivative is positive and decreasing where it is negative.
What does the concavity of a graph tell you about the second derivative?
-If the graph is concave up, the second derivative is positive, and if the graph is concave down, the second derivative is negative.
How can you sketch a possible graph of a function given its first and second derivative information?
-By using the first derivative to determine increasing and decreasing intervals and the second derivative to determine concavity, you can sketch the graph, noting points of inflection and any given points or values.
Outlines
📈 Analyzing Graphs and Derivatives
This paragraph discusses how to determine the sign of a function and its derivatives at various points on a graph. It explains that a function is positive if above the x-axis, negative if below, and zero if on the x-axis. The slope (first derivative) is analyzed at points A through E, indicating negative slopes at A, zero at B and D, and positive at C. The concavity (second derivative) is also examined, showing changes at point C, which is an inflection point. The paragraph also explains how to interpret the first and second derivatives in terms of increasing/decreasing and concave up/down behavior.
📚 Understanding the Behavior of Functions and Their Derivatives
The second paragraph delves into the implications of given mathematical conditions on the graph of a function. It explains that if the first derivative is negative, the function is decreasing, and if the second derivative is positive, the function is concave up. The paragraph uses graph C as an example of a function that meets these conditions. It also discusses the concept of twice differentiability and orders the values of a function and its derivatives at a specific point, highlighting the relationship between the values and the signs of the derivatives.
🔍 Identifying Relative Extrema and Points of Inflection
This paragraph focuses on identifying relative maxima and minima, as well as points of inflection from the graph of a function's derivative. It explains that relative maxima occur where the derivative changes from positive to negative, and relative minima occur where it changes from negative to positive. Points of inflection are identified where the derivative has a relative maximum or minimum, indicating a change in concavity. The paragraph also relates this to the first and second derivative tests, providing a comprehensive approach to analyzing the behavior of a function.
📉 Examining the Derivative Graph for Extrema and Inflection Points
The fourth paragraph examines a specific graph of a function's derivative to determine the values of x where the original function has relative maxima, minima, and points of inflection. It explains that there are no relative maxima since the derivative does not change from positive to negative. A relative minimum is identified at the point where the derivative changes from negative to positive. The paragraph also discusses the intervals where the original function is increasing or decreasing and where it is concave up or down, using the derivative graph to infer this information.
📌 Finding Normal and Tangent Line Approximations
This paragraph discusses the process of finding the equation of a normal line to a graph at a specific point and using the tangent line at that point to approximate the function's value at nearby points. It explains how to determine the slope of the normal line from the slope of the tangent line and how to use the tangent line equation to find approximations of the function's value at x = 2.9. The paragraph also considers the concavity of the graph to determine whether the approximation is an over or under estimation.
📘 Locating Relative Extrema and Inflection Points from a Table
The sixth paragraph uses a table of values for a function and its derivatives to identify points of relative extrema and inflection. It explains that relative extrema occur where the first derivative changes sign from positive to negative or vice versa. The paragraph identifies a relative maximum at x = 0 based on the sign change of the first derivative. It also locates a point of inflection at x = 2, where the second derivative changes sign. The intervals of increase and decrease, as well as concavity up and down, are determined from the sign charts of the first and second derivatives.
Mindmap
Keywords
💡Graph
💡Slope
💡Concavity
💡Derivative
💡Inflection Point
💡Increasing/Decreasing Function
💡Relative Maximum/Minimum
💡Tangent Line
💡Normal Line
💡Approximation
Highlights
The video explains how to determine the sign of a function and its derivatives at various points on a graph.
A function is positive if its point is above the x-axis, negative if below, and zero if on the x-axis.
The slope of a function at a point (first derivative) indicates whether the function is increasing or decreasing.
Concavity of a graph can be used to determine the sign of the second derivative.
An inflection point occurs where concavity changes, which corresponds to a zero second derivative.
The video demonstrates how to analyze the graph of a function to find its relative maxima and minima.
Relative maxima and minima are identified by changes in the sign of the first derivative.
Points of inflection are found where the second derivative changes sign or where the first derivative has a relative extremum.
The video uses a sign chart to organize information about a function's first and second derivatives.
The first derivative sign chart helps to determine intervals of increase and decrease for a function.
The second derivative sign chart is used to identify intervals where the function is concave up or down.
The video explains how to find the equation of a normal line to a curve at a given point.
The slope of the tangent line is used to determine the slope of the normal line, which is perpendicular.
The video demonstrates how to approximate function values using the tangent line at a specific point.
The concavity of a function at a point determines whether the tangent line approximation is an over or under estimation.
The video concludes with a problem involving finding relative extrema and points of inflection from given derivative information.
A function's behavior can be deduced from the signs of its first and second derivatives over an interval.
The video provides a method to sketch a possible graph of a function based on its derivative information.
Critical points and intervals of increase/decrease and concavity are used to construct the function's graph.
The video emphasizes the importance of understanding the relationship between a function's derivatives and its graphical representation.
Transcripts
Browse More Related Video

Calculus AB Homework 4.5: Second Derivative Test
Concavity, Inflection Points, Increasing Decreasing, First & Second Derivative - Calculus

What the Second Derivative Tells You about a Graph
Calculus AB Homework 3.1 The Sine and Cosine Functions
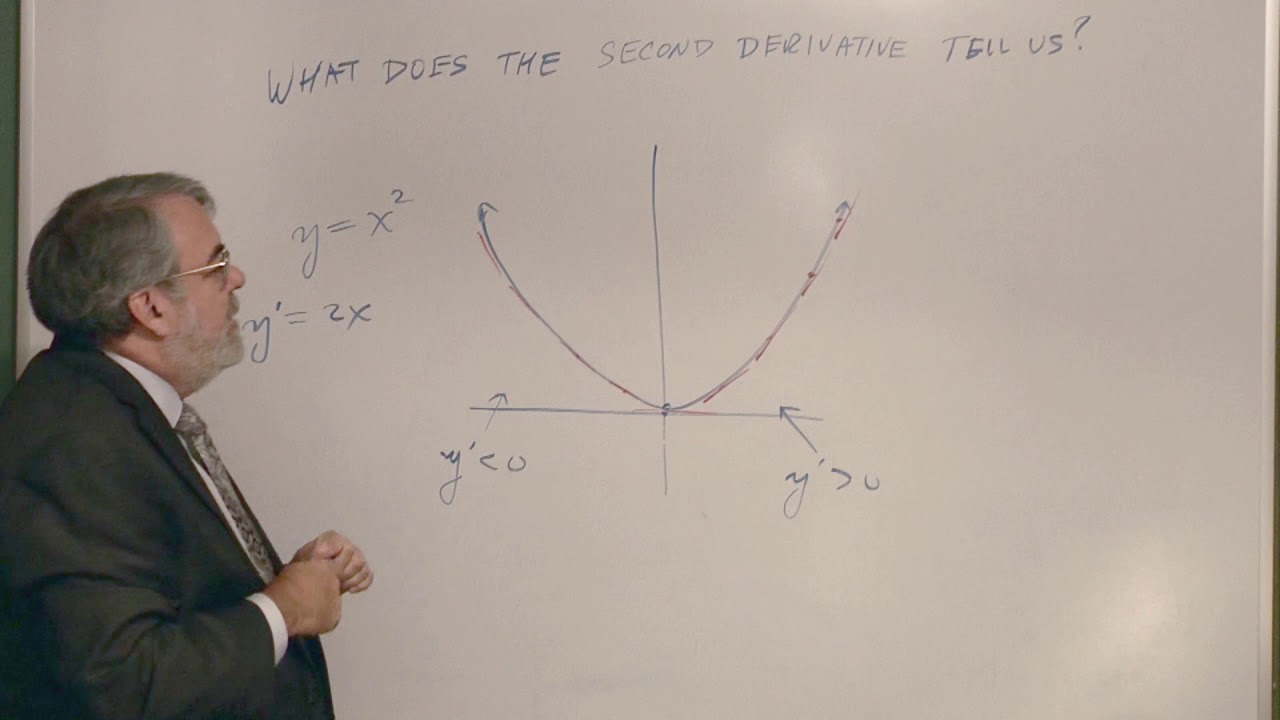
What the Second Derivative Tells Us

3.1 - Using First Derivatives to Classify Max and Min Values
5.0 / 5 (0 votes)
Thanks for rating: