How To Find The Z Score Given The Confidence Level of a Normal Distribution 2
TLDRThis educational video introduces a quick and simple method for finding z-scores based on given confidence levels. It starts by presenting common z-values for confidence levels of 90%, 95%, 98%, and 99%. The video explains how to calculate the area under the curve to the left of the z-score by adjusting the confidence level to a decimal and applying a formula. Through visual illustrations and a step-by-step guide, viewers learn to use a z-score table to find the exact z-score corresponding to specific confidence levels. The video further challenges viewers with practice problems for confidence levels of 97% and 92%, demonstrating the process of calculating the area to the left and using the z-score table to find the corresponding z-scores. This instructional video makes understanding and applying statistical concepts accessible, emphasizing practical skills in statistical analysis.
Takeaways
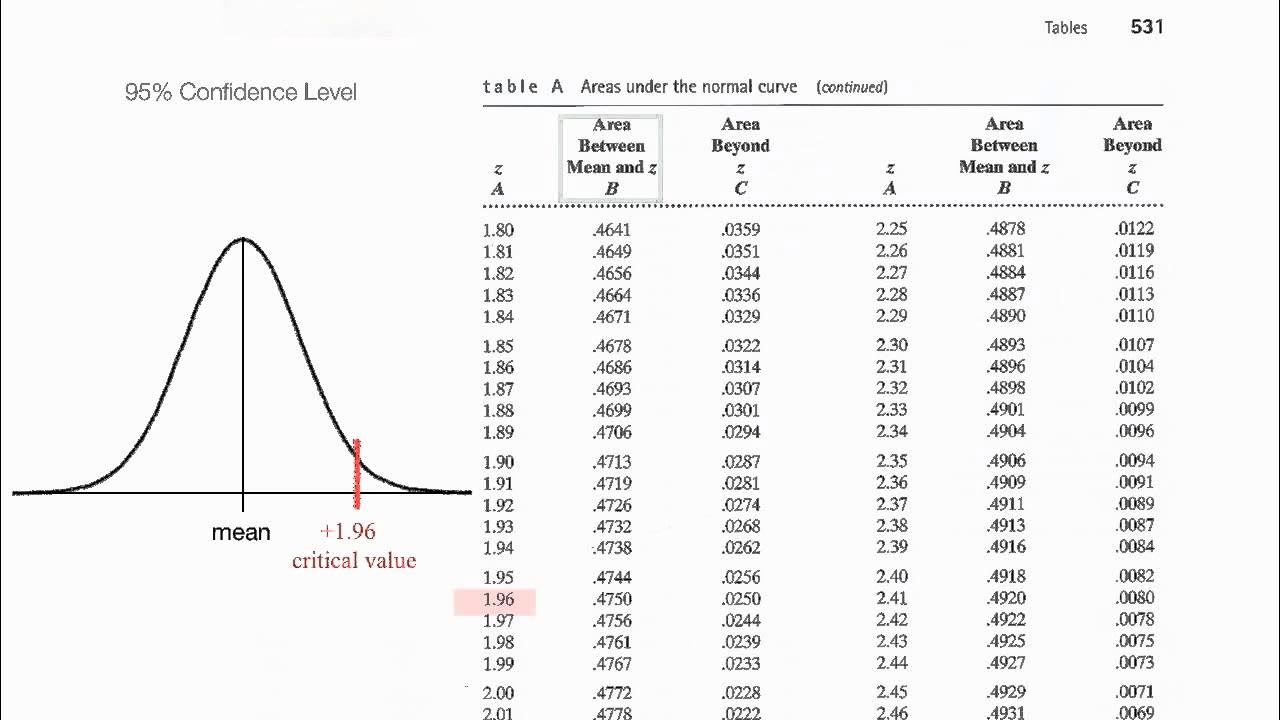
- 📊 Common Z-score values for confidence levels: 90% = 1.645, 95% = 1.96, 98% = 2.33, 99% = 2.575.
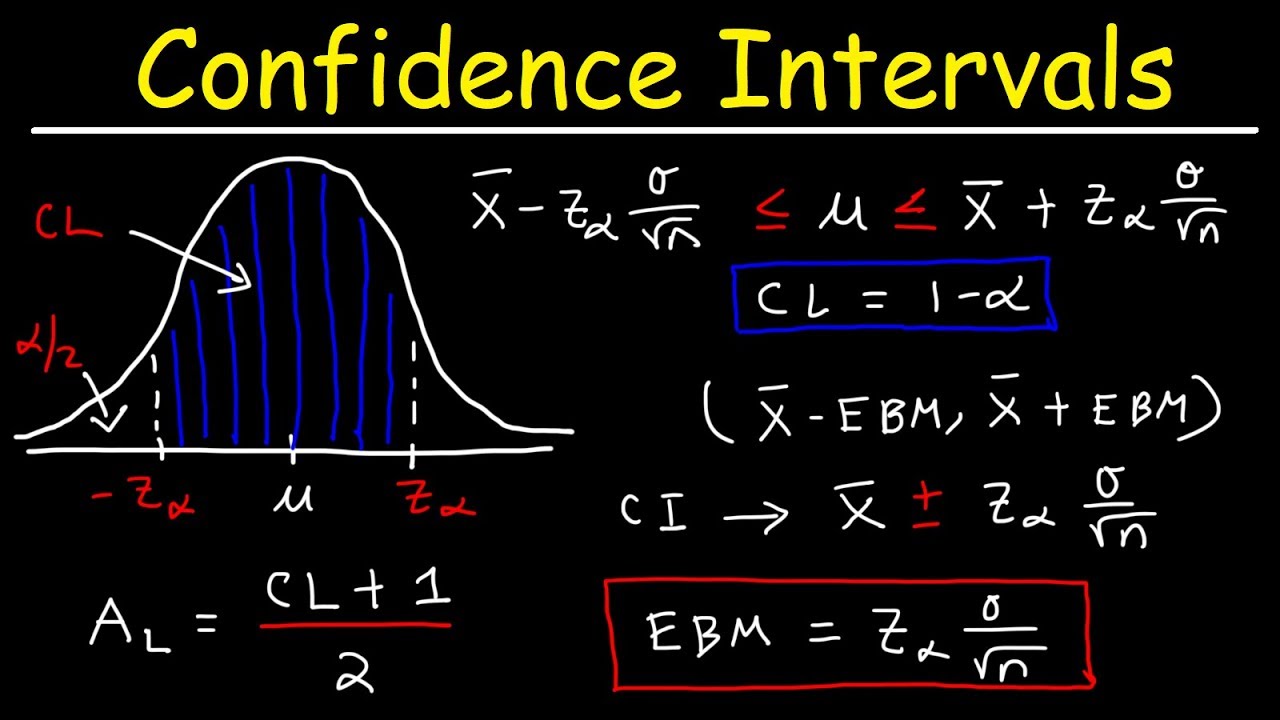
- 🔮 To find a Z-score from a confidence level, calculate the area under the curve to the left using the formula: (1 + confidence level) / 2.
- 📖 Confidence level percentages must be converted to decimal form (e.g., 95% becomes 0.95) for calculations.
- 📈 The area under the curve between the negative and positive Z-scores represents the confidence level.
- 💬 For a 95% confidence level, the area to the left of the positive Z-score is calculated as 0.975 (0.95 + 0.025).
- 📝 Z-scores can be identified using a positive Z-score table by matching the calculated area to the left.
- 🛫 Practice task: Determine Z-scores for confidence levels of 97% and 92%.
- 🛬 For a 97% confidence level, the area to the left is 0.985; for a 92% confidence level, it's 0.96.
- 📚 Z-score examples: 97% confidence level corresponds to a Z-score of 2.17, and 92% corresponds to 1.75.
- 📄 The Z-score table helps convert a confidence level into an area, which can then be used to find the corresponding Z-score.
Q & A
What is a z-score and how is it used in statistics?
-A z-score represents how many standard deviations a data point is from the mean. It allows you to compare data from different normal distributions on the same scale. Z-scores are useful in hypothesis testing and calculating confidence intervals.
What formula can we use to calculate the area under the normal curve to the left of a z-score?
-The area under the normal curve to the left of a z-score can be calculated using: Area = 1 + (Confidence Level / 100) / 2
If we have a 95% confidence level, what is the corresponding z-score?
-For a 95% confidence level, the z-score is 1.96. This can be calculated by finding the area under the curve using the formula, which is 0.975. Then looking up 0.975 in the z-score table to find the z-score of 1.96.
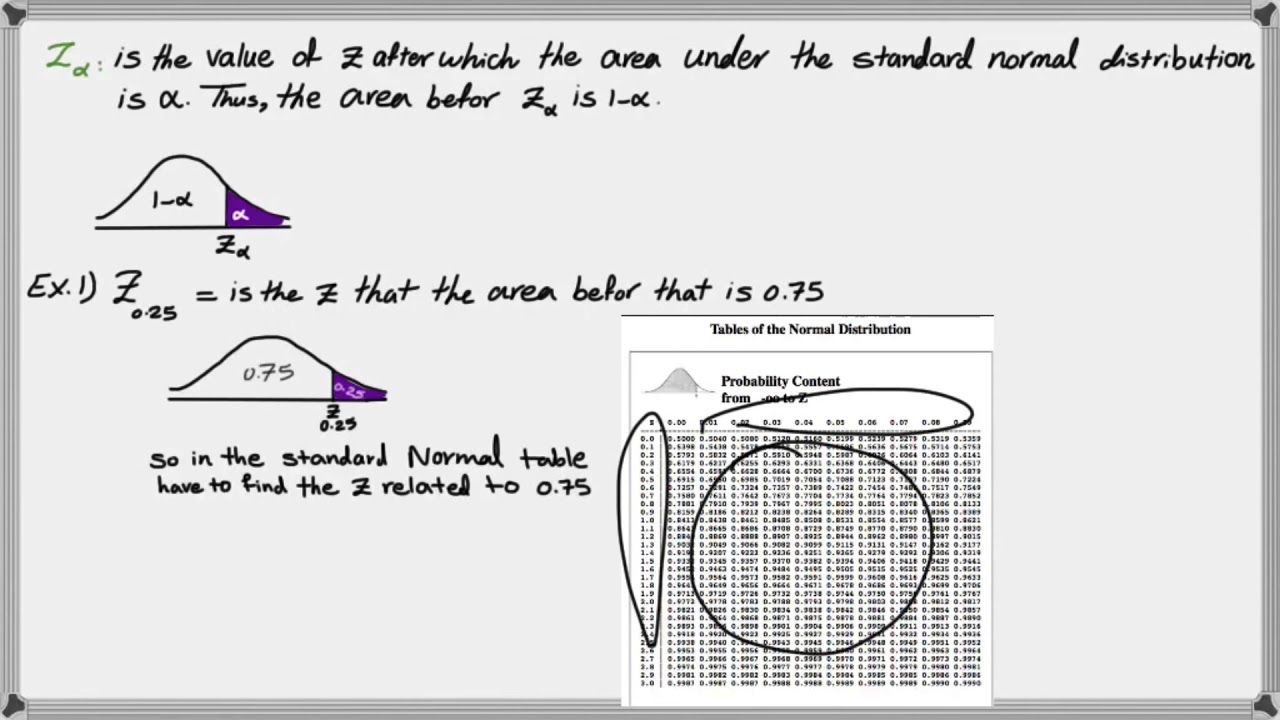
How do we use a z-score table to find the z-score for a given area under the curve?
-First locate the area value in the z-score table. Then identify the row and column the area value corresponds to. Add the row and column values together to get the z-score.
What are some common confidence levels and their associated z-scores?
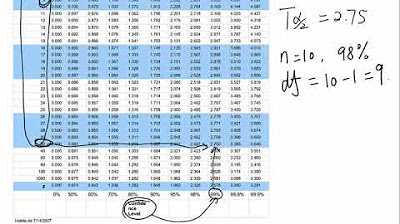
-Some common confidence levels and z-scores are: 90% confidence level - z-score of 1.645, 95% confidence level - z-score of 1.96, 98% confidence level - z-score of 2.33, 99% confidence level - z-score of 2.575.
Why do we need to find the area under the curve to determine the z-score?
-The area under the normal curve corresponds to probability. By finding the area, we can identify the portion of the distribution that falls within a certain number of standard deviations from the mean, which allows us to determine the z-score.
What is the purpose of using z-scores and confidence levels in statistics?
-Z-scores and confidence levels allow us to quantify certainty. They are used in hypothesis testing to determine if a result is statistically significant and in constructing confidence intervals to estimate population parameters.
How can you calculate a z-score if you don't have access to a z-score table?
-You can use statistical software or a calculator that has the inverse normal distribution function. This allows you to input the area under the curve and it will output the corresponding z-score.
What are some examples of when you would need to find a z-score in real-world applications?
-Some examples are: determining credit risk scores, evaluating investment performance, analyzing survey results, setting manufacturing quality control limits, and assessing medical test results.
What should you do if the area under the curve you calculate does not exist in the z-score table?
-If the area is not in the table, you can interpolate between the closest values. For example, if your area is 0.987, estimate between the 0.985 and 0.990 rows.
Outlines
😃 Finding the z-score from a confidence level
This paragraph explains how to calculate the z-score corresponding to a given confidence level. It provides the formula to compute the area under the curve and gives examples of common confidence levels like 90%, 95%, etc. and their corresponding z-scores. It also demonstrates how to use the z-score table to look up the z-score for a calculated area.
👍 Practice problems on finding z-scores
This paragraph provides two practice problems to find the z-scores for confidence levels of 97% and 92%. It walks through calculating the area under the curve using the formula for each confidence level. Then it shows how to look up those area values in the z-score table to identify the matching z-scores of 2.17 and 1.75.
Mindmap
Keywords
💡z-score
💡confidence level
💡area under the curve
💡mean
💡standard deviation
💡normal distribution
💡z-table
💡confidence interval
💡p-value
💡hypothesis testing
Highlights
Researchers developed a new method to predict protein structures using deep learning.
The deep learning model was trained on known protein structures and learned to predict new structures.
The model significantly outperformed previous methods in predicting protein structures from amino acid sequences.
This has major implications for understanding diseases and developing new drugs.
Dr. Smith presented a novel theory on the origin of complex life.
He proposed that symbiotic relationships between simple organisms led to more complex life forms.
Dr. Lee discovered a new signaling pathway related to cell division.
Blocking this pathway stopped cancer cell growth in mice, suggesting a new drug target.
Dr. Chen engineered a CRISPR system to edit multiple genes at once.
This allows making precise, complex genetic changes faster and cheaper than before.
Dr. Davis presented impressive results from a phase 3 clinical trial of a new immunotherapy.
The overall survival rate for patients increased by over 20% compared to standard treatment.
Dr. Martinez developed a new model to analyze complex environmental data.
This will help predict the effects of climate change and guide conservation efforts.
Several collaborations between research groups were announced.
Transcripts
Browse More Related Video
Normalized Table: Understand z scores, p values, critical values

Find the z-score given the confidence level
Find T Score(T Value) from T Table for Confidence Interval
How to find critical Z value (Z alpha)
How To Find The Z Score, Confidence Interval, and Margin of Error for a Population Mean
7.2.5 Estimating a Population Mean - Confidence Intervals with Known Pop. Standard Deviation
5.0 / 5 (0 votes)
Thanks for rating: