Curve Sketching - First & Second Derivatives - Graphing Rational Functions & Asymptotes - Calculus
TLDRThis video tutorial delves into sketching curves using calculus, focusing on the application of first and second derivatives. It explains how the signs of these derivatives can indicate the function's increasing or decreasing nature and concavity. The video provides step-by-step instructions for analyzing functions, complete with examples and a clear demonstration of how to create a rough sketch of a function's graph. The process is illustrated with detailed explanations, making it accessible for viewers to understand and apply to their own calculus problems.
Takeaways
- 📈 Understanding curves in calculus involves analyzing first and second derivatives to determine the shape of a function's graph.
- 📌 A function is increasing when its first derivative is positive, indicating a rise in the function's value.
- 📉 The first derivative is zero for a horizontal line, signifying neither increase nor decrease in the function's value.
- 🔼 When a function is decreasing, the first derivative is negative, reflecting a downward slope in the function.
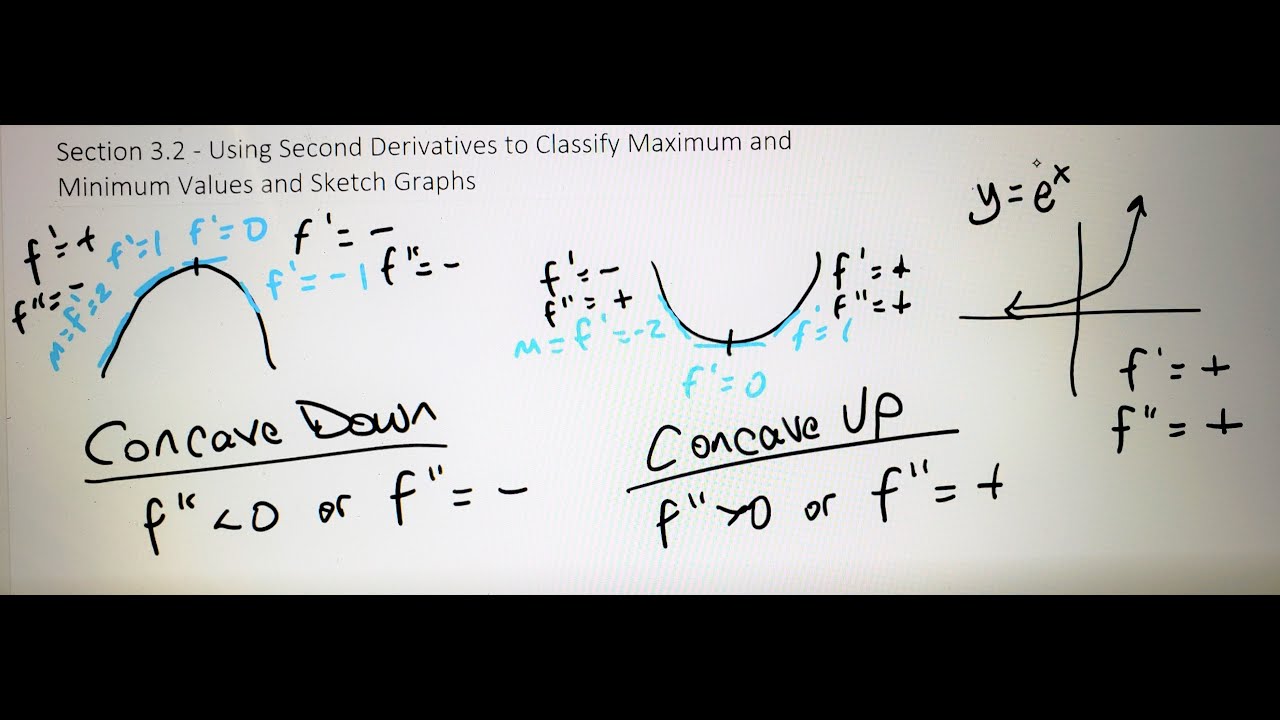
- 🔄 If the graph is concave up, the second derivative is positive, which means the first derivative is increasing.
- 🔃 Conversely, if the graph is concave down, the second derivative is negative, indicating the first derivative is decreasing.
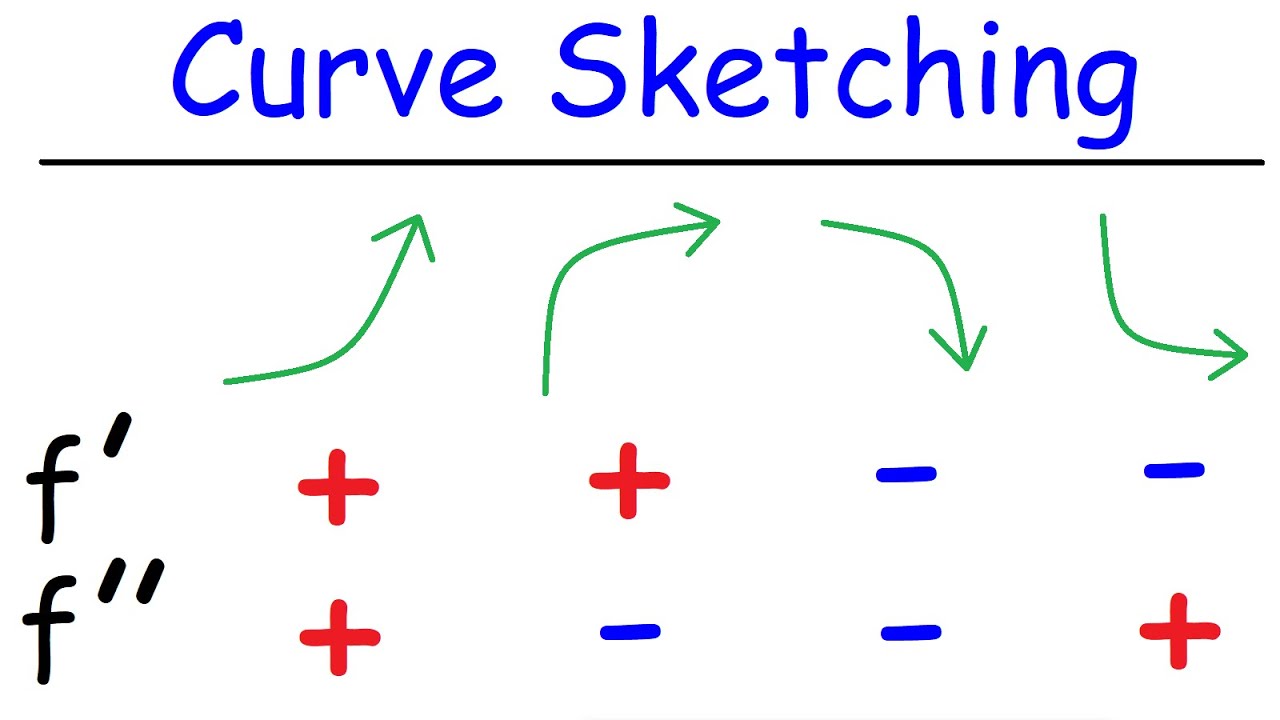
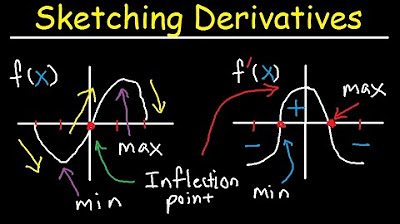
- 🌐 Four key shapes to recognize in calculus are increasing with positive first and second derivatives, decreasing with both negatives, increasing with a positive first and negative second derivative, and decreasing with a negative first and positive second derivative.
- 🔍 To sketch a function, find the first derivative, set it to zero to find critical points, and use a sign chart to determine where the function is increasing or decreasing.
- 📊 For more complex functions, like rational or radical expressions, additional techniques such as finding vertical and horizontal asymptotes, and using the quotient rule for derivatives, may be necessary.
- 🛠️ The first and second derivative tests can help identify local maxima, minima, inflection points, and the concavity of a function's graph.
- 📈 By combining the information from the first and second derivatives, a rough sketch of the function's graph can be drawn, revealing its key features and behavior.
Q & A
What is the relationship between a function's first derivative and its increasing or decreasing nature?
-If a function is increasing, its first derivative is positive. Conversely, if the function is decreasing, the first derivative is negative. If the function is constant (horizontal line), the first derivative is zero.
How does the concavity of a curve relate to the second derivative?
-If a curve is concave up, the second derivative is positive. If it's concave down, the second derivative is negative.
What does a positive second derivative indicate about the first derivative?
-A positive second derivative indicates that the first derivative is increasing in value.
What does a negative second derivative indicate about the first derivative?
-A negative second derivative indicates that the first derivative is decreasing in value.
How can you determine the critical points of a function?
-To find the critical points, set the first derivative of the function equal to zero and solve for x. These points are where the function may have a maximum, minimum, or inflection point.
What is the significance of the first and second derivatives in sketching a curve?
-The first and second derivatives help in determining the increasing or decreasing nature of the function and its concavity, which are crucial in sketching the curve and identifying features like maxima, minima, and inflection points.
How can you use the first and second derivative tests to analyze the graph of a function?
-By analyzing the first and second derivatives, you can determine where the function is increasing or decreasing and whether the curve is concave up or down. This information helps in sketching the graph and identifying critical points and the overall shape of the curve.
What is the relationship between the degree of the numerator and denominator of a rational function and its horizontal asymptote?
-If the degrees are the same, the horizontal asymptote is the ratio of the leading coefficients. If the degree of the numerator is less, the horizontal asymptote is y=0. If the degree of the numerator is more, there is no horizontal asymptote.
How do you find the vertical asymptote of a rational function?
-The vertical asymptote occurs at the value of x that makes the denominator zero, as the function will be undefined at that point.
What is the role of the quotient rule in differentiating a function?
-The quotient rule is used to find the derivative of a function that is the quotient of two other functions. It states that the derivative of f/g is (g*f' - f*g')/g^2.
How can you determine the domain of a function that includes a square root?
-The domain of a function with a square root is restricted to values of x for which the expression under the square root is non-negative, as you cannot take the square root of a negative number.
Outlines
📈 Understanding Curves with First and Second Derivatives
This paragraph introduces the concept of sketching curves using first and second derivatives in calculus. It explains the basic rules of derivatives: a positive first derivative indicates an increasing function, a zero first derivative indicates a horizontal line, and a negative first derivative indicates a decreasing function. The second derivative's sign reveals whether the first derivative is increasing (positive) or decreasing (negative) in value. The paragraph also discusses the analysis of two sample curves, highlighting how the first and second derivatives affect the shape of the curve.
📊 Sketching Functions Using Derivatives
The paragraph delves into the process of sketching a function using its first and second derivatives. It provides an example function and demonstrates how to find the first derivative, set it to zero, and factor it to find critical points. A sign chart is created to determine where the function is increasing or decreasing. The second derivative is then used to identify concave up or down shapes. The paragraph concludes with a method to combine the information from the first and second derivatives to sketch the graph of the function.
🤔 Analyzing the Graph with Derivatives
This paragraph continues the discussion on sketching graphs by analyzing the first and second derivatives. It explains how the signs of these derivatives can indicate whether the function is increasing or decreasing at an increasing or decreasing rate. The paragraph uses a number line to illustrate the points of interest and how they relate to the graph's shape. It also introduces the concept of local maximum and minimum points, inflection points, and the different types of shapes a graph can have based on the derivatives' signs.
📚 Graphing a Rational Function
The paragraph focuses on graphing a rational function without the need for first and second derivatives, but it still demonstrates the process. It explains how to find vertical and horizontal asymptotes using algebraic techniques. The paragraph also discusses the significance of the degrees of the numerator and denominator in determining the horizontal asymptote. The graph's behavior near the vertical asymptote and the general shape of the graph are described, including the potential shapes on the left and right sides of the vertical asymptote.
🧠 Derivative Analysis of a Complex Function
This paragraph presents a more complex function and explains how to find its first and second derivatives. It uses the quotient rule to derive the first derivative and then the power rule to find the second derivative. The paragraph identifies critical points and explains how to use these points to create a sign chart for both derivatives. It also discusses the implications of the first and second derivatives being positive or negative and how they affect the graph's concavity and increasing/decreasing nature. The paragraph concludes with a method to combine the information to sketch the graph.
📈 Final Sketch and Summary
The final paragraph wraps up the video by summarizing the process of graphing functions using first and second derivatives. It provides a clear example of how to find the x-intercepts and maximum point of the graph. The paragraph describes the overall shape of the graph, including its concavity and the behavior of the function at the critical points. It emphasizes the importance of understanding the relationship between the derivatives and the graph's shape, concluding with a reminder to the viewers to apply these concepts in their calculus studies.
Mindmap
Keywords
💡First Derivative
💡Second Derivative
💡Increasing Function
💡Decreasing Function
💡Concave Up
💡Concave Down
💡Critical Points
💡Sign Chart
💡Horizontal Asymptote
💡Vertical Asymptote
💡Inflection Point
Highlights
The video focuses on sketching curves using first and second derivatives in calculus.
When a function is increasing, the first derivative is positive.
A horizontal line indicates the function is constant, with the first derivative being zero.
If the function is decreasing, the first derivative is negative.
A concave up shape in the graph indicates a positive second derivative.
A concave down shape corresponds to a negative second derivative.
When the second derivative is positive, the first derivative increases in value.
A decreasing first derivative indicates a negative second derivative and a concave down shape.
Four key shapes in calculus are discussed to understand the behavior of functions.
The first derivative's sign change indicates a local maximum or minimum.
An inflection point occurs where the concavity changes, indicated by a zero second derivative.
The video provides an example of sketching a function using its first and second derivatives.
The process of finding critical numbers and creating a sign chart is demonstrated.
The video explains how to combine first and second derivative sign charts to sketch a graph.
Two additional examples are worked through, applying the concepts of first and second derivatives.
The importance of understanding the relationship between derivatives and the shape of a graph is emphasized.
The video concludes with a summary of how to use first and second derivatives to graph functions effectively.
Transcripts
Browse More Related Video
Curve Sketching - Graphing Functions Using Derivatives | Calculus
Business Calculus - Math 1329 - Section 3.3 - Curve Sketching
Calculus AB Homework 2.4 The Second Derivative
Calculus AB Homework 4.6: Relationship between f, f', and f''
Math 11 - Section 3.2
Sketching Derivatives From Parent Functions - f f' f'' Graphs - f(x), Calculus
5.0 / 5 (0 votes)
Thanks for rating: