Graphing a Polynomial Equation :: Curve Sketching Using Calculus
TLDRThis educational video offers a step-by-step guide on utilizing calculus to sketch the graph of the polynomial function f(x) = 4x^3 + 12x^2 - 3. The process begins with finding critical numbers using the first derivative to identify intervals of increase and decrease, and to locate relative maxima and minima. The second derivative is then employed to determine points of inflection and intervals of concavity, revealing the graph's curvature. Additional points are plotted for a more precise sketch, and the function's behavior is deduced through these intervals. The video concludes with a detailed graph that illustrates the function's characteristics, showcasing the power of calculus in graphing polynomial functions.
Takeaways
- 📚 The video provides a step-by-step guide on using calculus to sketch the graph of polynomial functions.
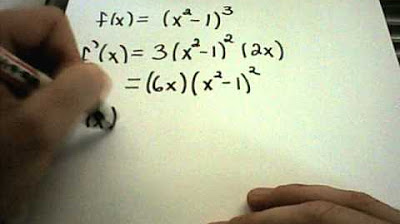
- 🔍 It uses the polynomial function f(x) = 4x^3 + 12x^2 - 3 as an example to demonstrate the graph sketching process.
- 📈 The first step involves finding the first derivative of the function to identify critical numbers, intervals of increase/decrease, and extreme values.
- 🔑 The first derivative of the given function is found using the power rule, resulting in 12x^2 + 24x.
- 🎯 Critical numbers are calculated by setting the first derivative equal to zero, yielding x = 0 and x = -2 for the example function.
- 📉 To determine if the function is increasing or decreasing, the sign of the first derivative within different intervals defined by critical numbers is analyzed.
- 📌 The extrema, or maximum and minimum points, are identified as a relative maximum at x = -2 and a relative minimum at x = 0.
- 📘 The second derivative test is introduced to find possible points of inflection and intervals of concavity.
- 📐 The second derivative of the function is calculated as 24x + 24, and setting it to zero gives a possible point of inflection at x = -1.
- 🔍 By analyzing the sign of the second derivative, the intervals of concavity (concave up and concave down) are determined.
- 📊 Additional points are plotted to aid in sketching the graph more accurately, including points to the left and right of the identified critical numbers and extrema.
- 🖌️ The final graph is sketched by combining all the information: intervals of increase/decrease, concavity, and the plotted points.
Q & A
What is the main topic of the video?
-The main topic of the video is how to use calculus to sketch the graph of polynomial functions, specifically the function f(x) = 4x^3 + 12x^2 - 3.
What are the critical numbers in the context of sketching a graph?
-Critical numbers are the values of x where the first derivative of the function equals zero or where the first derivative does not exist. They help identify intervals where the function is increasing or decreasing and where extrema occur.
What are the extrema in the context of a function's graph?
-Extrema refer to the maximum and minimum points on the graph of a function, also known as peaks and valleys.
How does the video determine the intervals where the function is increasing or decreasing?
-The video uses the first derivative to determine these intervals. By evaluating the sign of the first derivative within the intervals defined by the critical numbers, it is possible to determine whether the function is increasing or decreasing in each interval.
What is the first derivative of the given function f(x) = 4x^3 + 12x^2 - 3?
-The first derivative of the function f(x) = 4x^3 + 12x^2 - 3 is f'(x) = 12x^2 + 24x.
How are the critical numbers found in the video?
-The critical numbers are found by setting the first derivative equal to zero and solving for x. In the video, the first derivative is factored to 12x(x + 2), and setting each factor to zero gives the critical numbers x = 0 and x = -2.
What is a point of inflection?
-A point of inflection is a point on the graph where the concavity changes, meaning the graph goes from being concave up to concave down or vice versa.
How is the second derivative used in the video to identify points of inflection?
-The second derivative is set equal to zero to find possible points of inflection. In the video, the second derivative is 24x + 24, and solving this equal to zero gives x = -1, which is a possible point of inflection.
What are the intervals of concavity identified in the video?
-The intervals of concavity identified in the video are concave down from negative infinity to x = -1 and concave up from x = -1 to infinity.
How does the video use additional points to sketch the graph more accurately?
-The video suggests plotting additional points to the left and right of the critical numbers and points of inflection to help draw the graph more accurately. These points help define the shape of the graph as it increases, decreases, and changes concavity.
What is the final step in sketching the graph according to the video?
-The final step is to plot all the points found, including maximum and minimum values, points of inflection, and additional points, and then draw the graph by connecting these points in a manner that reflects the intervals of increase/decrease and concavity.
Outlines
📚 Introduction to Sketching Polynomial Graphs with Calculus
This paragraph introduces the video's objective, which is to demonstrate the use of calculus to sketch the graph of polynomial functions. The presenter chooses a specific function, f(x) = 4x^3 + 12x^2 - 3, as an example. The process involves identifying critical numbers where the first derivative is zero or undefined, determining intervals of increase and decrease, and locating extrema (maxima and minima). The video also covers finding points of inflection and intervals of concavity by using the second derivative. The first step is to find the first derivative of the given polynomial function using the power rule, resulting in f'(x) = 12x^2 + 24x. The presenter then explains how to find critical numbers by setting the first derivative equal to zero and factoring out common terms.
🔍 Analyzing Critical Numbers and Extrema
The presenter continues by solving for critical numbers, which are found by setting the first derivative equal to zero. In this case, factoring out 12x from f'(x) = 12x^2 + 24x yields x factors of 12x = 0 and x + 2 = 0, resulting in critical numbers x = 0 and x = -2. These numbers divide the domain into intervals that the presenter examines to determine whether the function is increasing or decreasing within each interval. By substituting values from each interval into the first derivative, the presenter concludes that the function is increasing on the intervals (-∞, -2) and (0, ∞) and decreasing on the interval (-2, 0). Additionally, the presenter identifies extrema by observing the behavior of the function around the critical numbers, concluding that there is a relative maximum at x = -2 and a relative minimum at x = 0.
🔄 Using the Second Derivative to Find Points of Inflection
The presenter then moves on to the second derivative, which is calculated as f''(x) = 24x + 24. Possible points of inflection are found by setting the second derivative equal to zero, leading to x = -1. This value divides the domain into two intervals, and the presenter tests each interval by substituting values into the second derivative to determine the concavity of the function. The function is found to be concave down on the interval (-∞, -1) and concave up on the interval (-1, ∞). The point x = -1 is identified as a point of inflection, and the corresponding y-value is calculated by evaluating the original function at x = -1, yielding the point (-1, 5).
🎨 Sketching the Graph Based on Derivative Analysis
Finally, the presenter synthesizes the information gathered from the first and second derivatives to sketch the graph of the function. Key points, including the maximum, minimum, and point of inflection, are plotted on the coordinate plane. Additional points are chosen to the left and right of the identified points to aid in graphing. The presenter then uses the information about intervals of increase and decrease, as well as concavity, to draw the graph. The graph is drawn with increasing and decreasing slopes and concave up and down shapes, passing through the plotted points. The final graph accurately represents the function's behavior as described by the derivatives, completing the process of sketching the polynomial function's graph using calculus.
Mindmap
Keywords
💡Calculus
💡Polynomial Functions
💡Critical Numbers
💡First Derivative
💡Extrema
💡Second Derivative
💡Points of Inflection
💡Concavity
💡Increasing/Decreasing Intervals
💡Graph Sketching
Highlights
The video demonstrates using calculus to sketch the graph of polynomial functions.
A specific polynomial function, f(x) = 4x^3 + 12x^2 - 3, is used as an example.
Calculus is utilized to identify critical numbers where the first derivative equals zero or does not exist.
Critical numbers help in determining intervals of increasing and decreasing function values.
Extrema, or maximum and minimum points, are identified using calculus.
The second derivative is used to find possible points of inflection and intervals of concavity.
The first derivative of the given polynomial is calculated using the power rule.
Factoring the first derivative helps find critical numbers.
Critical numbers divide the domain into intervals for analyzing the function's behavior.
The function's increasing and decreasing intervals are determined by evaluating the first derivative within those intervals.
Extrema occur at critical numbers where the function changes from increasing to decreasing or vice versa.
The second derivative is calculated to find potential points of inflection.
A possible point of inflection is found where the second derivative equals zero.
Intervals of concavity are identified by evaluating the second derivative.
The point of inflection is determined where the concavity changes.
Additional points are plotted to aid in sketching the graph accurately.
The graph is sketched by combining all the information about increasing/decreasing intervals, extrema, points of inflection, and concavity.
The final graph is drawn by connecting the points and considering the function's behavior as determined by calculus.
Transcripts
Browse More Related Video
Relative Maxima/Minima Examples
Graphs of f, f prime, and f double prime
Graphing using derivatives | Derivative applications | Differential Calculus | Khan Academy
Increasing/Decreasing + Local Max and Mins using First Derivative Test

Calculus I: Finding Intervals of Concavity and Inflection point
AP Calc - Graphing f from f'
5.0 / 5 (0 votes)
Thanks for rating: