Math 11 - Section 3.1
TLDRProfessor Monti's lecture focuses on applied calculus, specifically using first derivatives to classify maximum and minimum values of functions and sketch their graphs. The video begins with a discussion on the behavior of functions, explaining when they are considered increasing or decreasing. The concept of a function's increasing nature is associated with a positive derivative, while a decreasing function has a negative derivative. The lecture then delves into identifying relative maxima and minima, which are the highest and lowest points within an interval, respectively. Professor Monti emphasizes that these can only occur at critical points where the derivative is either zero or undefined. The process of finding critical values and relative extrema is demonstrated through various examples, including polynomial and rational functions. The use of sign charts and the quotient rule for derivatives are also covered. The video concludes with a reminder that understanding the concepts is key to solving calculus problems, rather than simply memorizing formulas. The lecture is practical, applying mathematical rules to sketch graphs and find function extrema, which is crucial for students transitioning from theoretical calculus to its applied use.
Takeaways
- 📈 Understanding when a function is increasing or decreasing is fundamental. A function is increasing when its graph rises from left to right, and decreasing when it falls.
- 🔢 The first derivative, f'(x), indicates the slope of the tangent line to the graph. If f'(x) > 0, the graph is increasing; if f'(x) < 0, it's decreasing.
- 🎓 A relative maximum or minimum is a highest or lowest point within an interval of a function's graph. These are referred to as extrema.
- 🔍 To find relative extrema, one must look for critical values, which occur where the derivative is zero or undefined.
- 📊 Sketching graphs of functions can be aided by using calculus to determine where the function is increasing or decreasing and to identify extrema.
- 🤔 The sign of the first derivative changes at critical points, which is a key concept in determining the intervals of increase or decrease and the location of extrema.
- ✏️ The process of finding critical values and extrema involves setting the first derivative equal to zero and solving for x, then using a sign chart to determine the behavior of the function.
- 📌 When the derivative of a function is a fraction, the quotient rule is used to find the derivative, which is essential for finding critical values.
- 📈 The behavior of a function (whether it's increasing or decreasing) can be determined by plugging in test values from the intervals defined by the critical values into the derivative.
- 📐 Sketching the graph of a function involves understanding the function's behavior and using calculus to plot key points such as extrema.
- 🚫 It's important to remember that not all functions have relative extrema. If a function continues to increase or decrease without changing direction, it does not have a relative extremum within that interval.
- 📚 Practice is crucial for solidifying the understanding of these concepts, as they form the basis for more advanced calculus work.
Q & A
What is the main focus of Chapter 3 in applied calculus?
-The main focus of Chapter 3 is on using first derivatives to classify maximum and minimum values of functions and to sketch their graphs.
How does a function's behavior change when its derivative is positive?
-When the derivative of a function is positive, the function is increasing, meaning its value is getting higher as you move from left to right on the graph.
What does it mean for a function to have a relative maximum?
-A relative maximum is the highest point of a function within a certain interval. It is not necessarily the highest point on the entire graph but the highest within the considered interval.
What is the term used to describe the points where a function has a relative maximum or minimum?
-The points where a function has a relative maximum or minimum are often referred to as extremum or extreme points, and collectively as extrema.
What are critical values in the context of calculus?
-Critical values are points where the derivative of a function is either zero or undefined. These points are significant because they are where relative maxima or minima can occur.
How can you determine the intervals where a function is increasing or decreasing?
-You can determine the intervals by testing values within each interval between critical values in the derivative of the function. If the derivative is positive, the function is increasing; if negative, it is decreasing.
What is the sign chart used for in calculus?
-A sign chart is used to determine the behavior of a function over different intervals by analyzing the sign of the derivative within each interval.
How does the shape of a graph change when the derivative is negative?
-When the derivative of a graph is negative, the graph is decreasing, meaning it is moving downward as you move from left to right.
What is the quotient rule used for in calculus?
-The quotient rule is used to find the derivative of a function that is expressed as a fraction, where both the numerator and the denominator are functions of the variable.
What does it imply if a function's graph has a horizontal asymptote?
-If a function's graph has a horizontal asymptote, it implies that the graph approaches but never intersects a horizontal line at a certain value as it extends to infinity in both directions.
What is the significance of finding relative extrema in calculus?
-Finding relative extrema is significant because it helps identify the highest or lowest points of a function within a certain interval, which is crucial in optimization problems and understanding the behavior of the function.
Outlines
📘 Introduction to Applied Calculus in Chapter 3
Professor Monti introduces Chapter 3, focusing on applied calculus and how to use first derivatives to determine the increasing or decreasing nature of functions. He explains the concepts of maximum and minimum values through graph analysis, emphasizing how a positive derivative indicates an increasing function and a negative derivative denotes a decreasing function. The session also covers how to interpret critical values where the derivative is zero or undefined, essential for identifying relative maximums or minimums.
🔍 Analyzing Graphs for Relative Maximums and Minimums
This paragraph delves deeper into graph analysis, specifically looking for points of relative maximum and minimum, termed as extremums. Professor Monti explains that these points occur where the derivative is zero or undefined, using a graph to illustrate his points. He emphasizes understanding the conditions under which these critical values occur, using graphical examples to show how extremums are identified on a plot.
📉 Examining Graph Behavior and Transition Points
Professor Monti discusses how to interpret graph behavior around specific x-values, explaining the shift from decreasing to increasing intervals and vice versa. He uses an example where a graph changes direction at x equals one and discusses possible shapes the graph might take based on the derivative's behavior. This analysis helps in visualizing how a function can change its increasing or decreasing trend based on its derivative.
📊 Graphical Interpretations and Calculus Applications
In this section, Professor Monti extends the discussion on how calculus is used to sketch graphs and identify graph characteristics such as increasing and decreasing intervals and points of inflection. He presents another example to illustrate how to apply first derivatives to sketch and analyze graphs, focusing on critical values and extremums. The example helps elucidate the practical application of calculus in understanding complex graph behaviors.
🔢 Calculus Techniques for Analyzing Functions
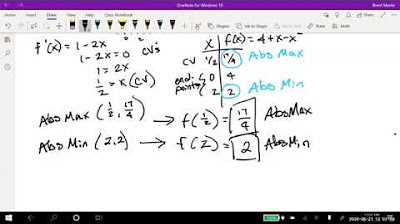
This paragraph outlines the step-by-step calculus techniques used to find critical values and relative extrema of functions. Professor Monti discusses using a sign chart to determine intervals of increase and decrease for a quadratic function and explains how these intervals lead to identifying a relative minimum. The example demonstrates the methodical approach required in calculus to dissect and understand the behavior of mathematical functions through their derivatives.
📏 Detailed Analysis of Graphical Intervals and Derivative Applications
Professor Monti explains the process of analyzing a more complex function, demonstrating how to use derivatives to define intervals of increasing and decreasing behavior in the function. By setting critical values and testing intervals, he shows how to predict the function’s behavior, leading to the identification of relative maximums and minimums. The detailed analysis underscores the importance of calculus in interpreting and predicting function behavior graphically.
🧮 Exploring Complex Function Graphs and Their Extremes
Continuing with complex functions, this paragraph focuses on a function with a cubic root, illustrating the challenges of finding relative extrema. Professor Monti explores how derivatives are used to determine when the function increases or decreases, leading to the realization that not all functions will have relative maximums or minimums, especially if their rate of change does not switch directions. This discussion highlights the nuanced understanding of calculus required to analyze such functions.
📑 Advanced Calculus Applications in Real-World Problems
The final paragraph summarizes how advanced calculus techniques are applied in solving real-world problems, particularly in graphing and analyzing complex functions. Professor Monti emphasizes the importance of understanding derivatives for setting critical values and predicting function behaviors, reiterating the practical applications of calculus in various fields of study and industry. This section serves as a capstone, tying together all the calculus concepts discussed in previous sections.
Mindmap
Keywords
💡Applied Calculus
💡Derivatives
💡Increasing Function
💡Decreasing Function
💡Tangent Line
💡Relative Maximum and Minimum
💡Critical Values
💡Sign Chart
💡Extrema
💡Continuous Function
💡Quotient Rule
Highlights
Professor Monti introduces Chapter 3 on applied calculus, focusing on using first derivatives to classify maximum and minimum values and sketch graphs.
A function is increasing if it goes up from left to right, and decreasing if it goes down, as read on a graph.
The formal definition of an increasing function is that for any X1 < X2, f(X1) < f(X2).
The tangent line's slope (the derivative) is positive when the function is increasing and negative when the function is decreasing.
Relative maximums and minimums are the highest and lowest points in an interval, respectively, and can only occur at critical values where the derivative is zero or undefined.
Critical values are points where the derivative equals zero or is undefined, and they are key to identifying relative extrema.
The process of sketching graphs using calculus involves determining where the function is increasing or decreasing and identifying any relative extrema.
The sign chart is a useful tool for determining intervals of increase or decrease by testing values between critical values.
The concept of a horizontal asymptote is introduced, where a graph approaches a horizontal line but never intersects it.
The quotient rule for derivatives is applied to fractions, simplifying the process of finding critical values.
The importance of understanding the behavior of the derivative (increasing or decreasing) to sketch the graph accurately is emphasized.
The method for finding relative extrema involves setting the derivative to zero, solving for x, and then analyzing the intervals around critical points.
The transcript includes a detailed example of finding the relative extrema of the function f(x) = x^2 - 6x + 1, demonstrating the process step by step.
The concept of a function's graph having no relative extrema is explained, showing that a graph can continuously increase or decrease without any maximum or minimum points.
The final example demonstrates finding the relative extrema of a function involving a fraction, showcasing the application of the quotient rule and analysis of the graph's behavior.
The importance of practice in applying calculus to find relative extrema and sketch graphs is stressed, as it is a fundamental skill in understanding calculus.
The session concludes with encouragement for students to work through problems and seek clarification in live sessions, highlighting the support available for learning.
Transcripts
Browse More Related Video


5.0 / 5 (0 votes)
Thanks for rating: