Correlation Coefficient
TLDRThe video explains the correlation coefficient, which measures the strength and direction of the linear relationship between two variables. It illustrates different correlation scenarios using scatter plots. A step-by-step calculation shows how to compute the coefficient using sample data tables and the correlation formula. The result is a value between -1 and 1, with 1/-1 indicating a perfect positive/negative linear correlation and 0 indicating no linear relationship. The video concludes that the computed high positive value indicates a strong direct linear relationship between the example variables.
Takeaways
- 👍 The correlation coefficient measures the strength and direction of a linear relationship between two variables.
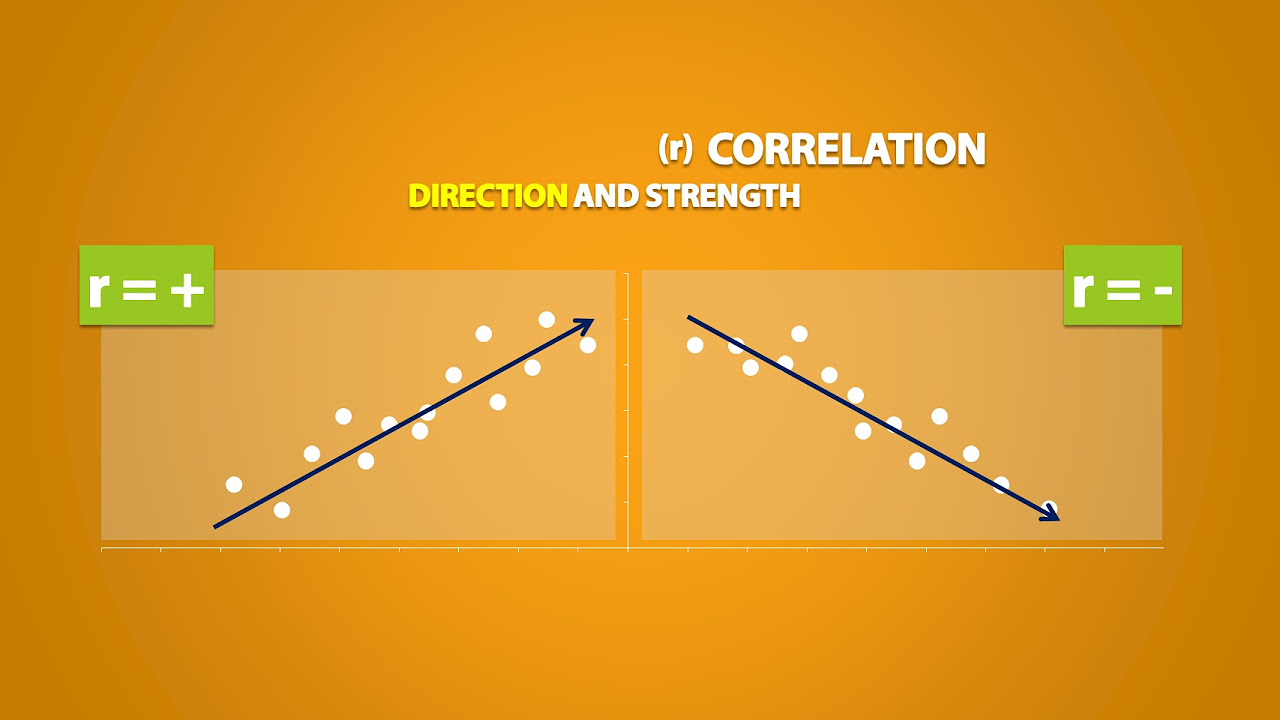
- 📈 A positive correlation coefficient (close to +1) indicates a direct relationship where, as one variable increases, the other variable also increases.
- 📉 A negative correlation coefficient (close to -1) indicates an inverse relationship where, as one variable increases, the other decreases.
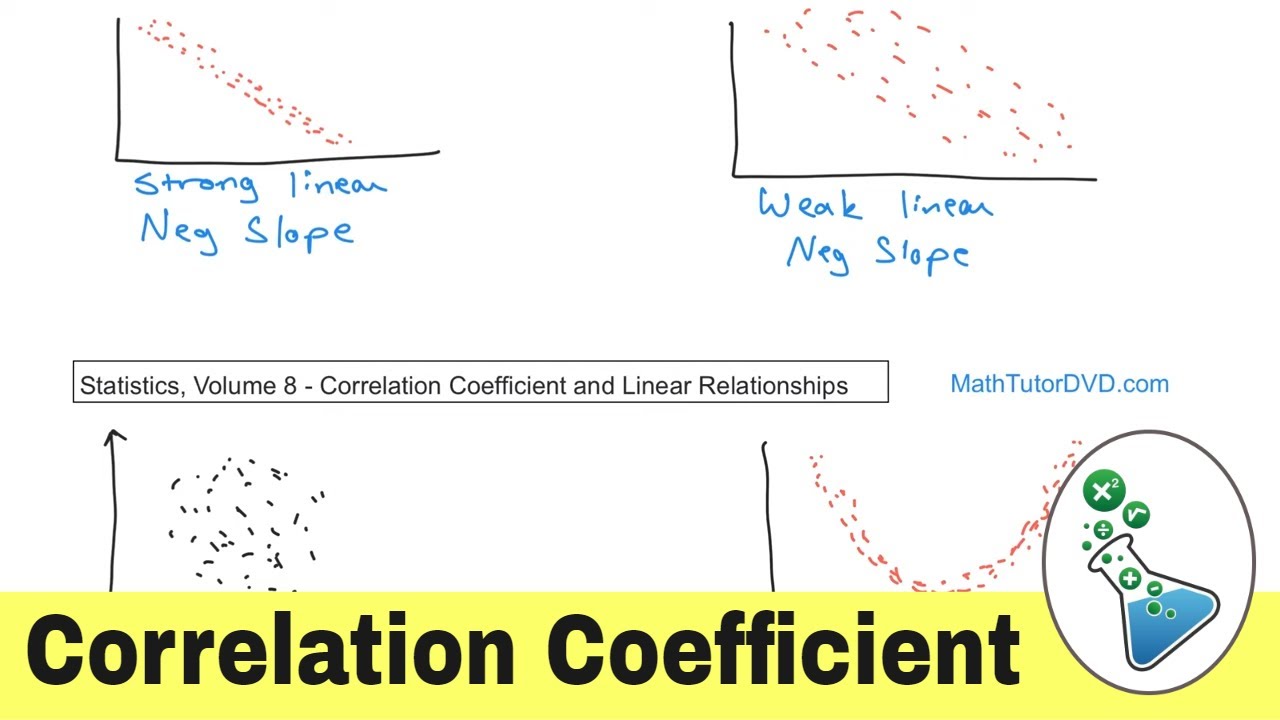
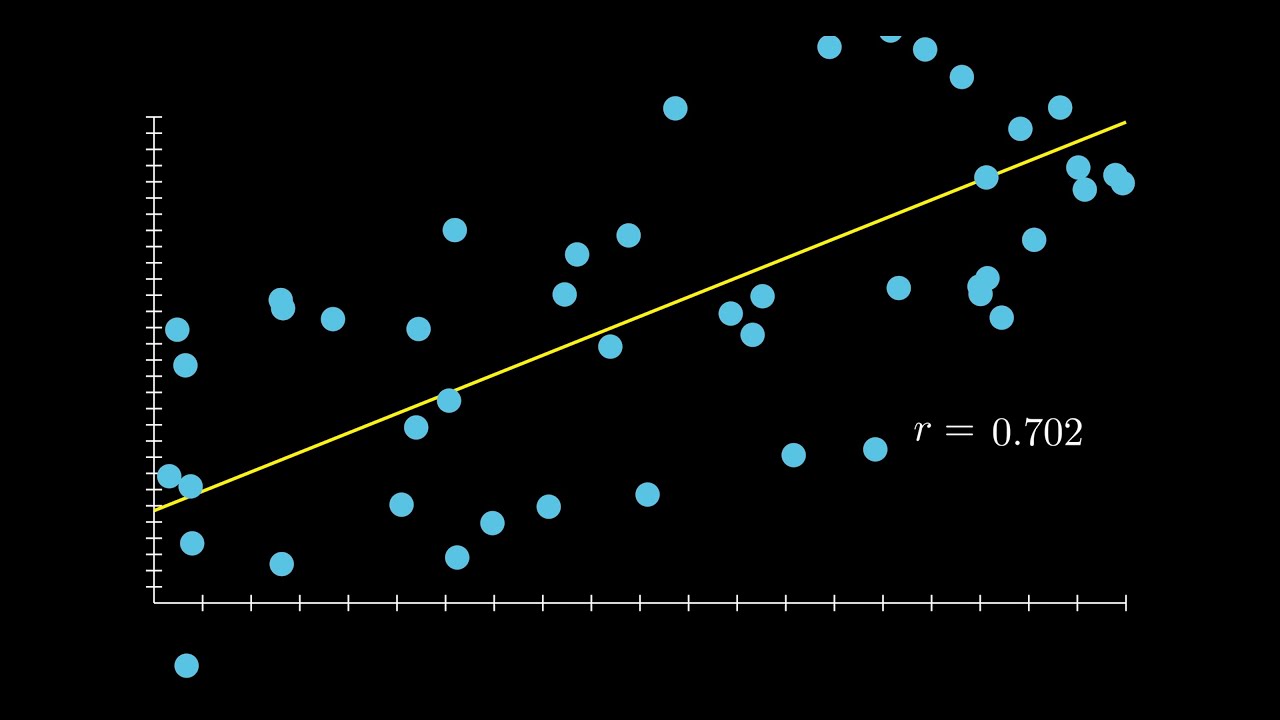
- 🔍 The closer the data points are to a straight line, the closer the correlation coefficient is to either +1 or -1, reflecting a stronger linear relationship.
- 📊 If data points are widely scattered around a line, the correlation coefficient will be closer to 0, indicating a weaker linear relationship.
- 🚫 No apparent linear relationship between two variables results in a correlation coefficient very close to 0.
- ✏️ To calculate the correlation coefficient, create a table with columns for X, Y, XY, X squared, and Y squared, then sum each column.
- 📝 The formula for the correlation coefficient is (r = (n(Σxy) - (Σx)(Σy))/(sqrt[(nΣx^2 - (Σx)^2][nΣy^2 - (Σy)^2])), where n is the number of pairs, Σ denotes summation.
- ✔️ An example calculation with X and Y values provided results in a correlation coefficient of approximately 0.998, indicating a very strong positive linear relationship.
- ℹ️ The sign of the correlation coefficient (+ or -) indicates the direction of the relationship, while its magnitude (close to 1 or -1) indicates the strength of the linear relationship.
Q & A
What does the correlation coefficient r tell us about two variables?
-The correlation coefficient r tells us the strength of the linear relationship between two variables. If r is close to 1 or -1, it indicates a strong linear relationship. If r is close to 0, it indicates little to no linear relationship.
How can you determine if two variables have a positive or negative correlation?
-If r is positive, there is a direct relationship between the variables (as x increases, y increases). If r is negative, there is an inverse relationship (as x increases, y decreases).
What are some example r values for different relationships?
-If two variables have a perfect linear relationship, r = 1 or -1. If there is a strong correlation, r may be around 0.8. For a weaker correlation, r may be 0.5-0.7. If there is no correlation, r will be close to 0.
What is n in the correlation coefficient formula?
-n represents the number of data points (x,y pairs) being used to calculate the correlation coefficient.
What do the sums represent in the r formula?
-The sums represent: ∑xy (sum of x*y products), ∑x (sum of x values), ∑y (sum of y values), ∑x2 (sum of squared x values), ∑y2 (sum of squared y values).
Why do we square the x and y values?
-Squaring the x and y values allows us to account for both positive and negative values appropriately when calculating the sums.
What do the steps for calculating r involve?
-The steps are: 1) Create a table with columns for x, y, xy, x2, and y2. 2) Fill in the table values. 3) Sum each column. 4) Plug the sums into the correlation formula and simplify.
What does the example in the video indicate about x and y?
-The very high r value of 0.998 indicates there is a strong positive linear relationship between x and y in the data. As x increases, y also increases.
What if I calculate a negative r value?
-A negative r value indicates an inverse relationship - as x increases, y decreases. The strength of the linear relationship is still indicated by the absolute value of r.
Can r indicate nonlinear relationships?
-No, the correlation coefficient r only measures the strength of linear relationships between variables. Other techniques would be needed to assess nonlinear relationships.
Outlines
📈 Understanding the Correlation Coefficient
This segment introduces the concept of the correlation coefficient, explaining its significance in determining the relationship between two variables. The correlation coefficient (r) varies from -1 to 1, indicating the strength and direction of a linear relationship. A positive correlation (r = 1) signifies a direct relationship with a positive slope where as one variable increases, so does the other. Conversely, a negative correlation (r = -1) indicates an inverse relationship with a negative slope. The video illustrates scenarios with points on a line (perfect correlation), near a line (strong but imperfect correlation), and scattered points (weak correlation), emphasizing how the proximity of data points to the line affects the value of r. It also mentions the scenario of no apparent correlation (r close to 0), setting the stage for a practical example on how to calculate the correlation coefficient.
🔢 Calculating the Correlation Coefficient Step-by-Step
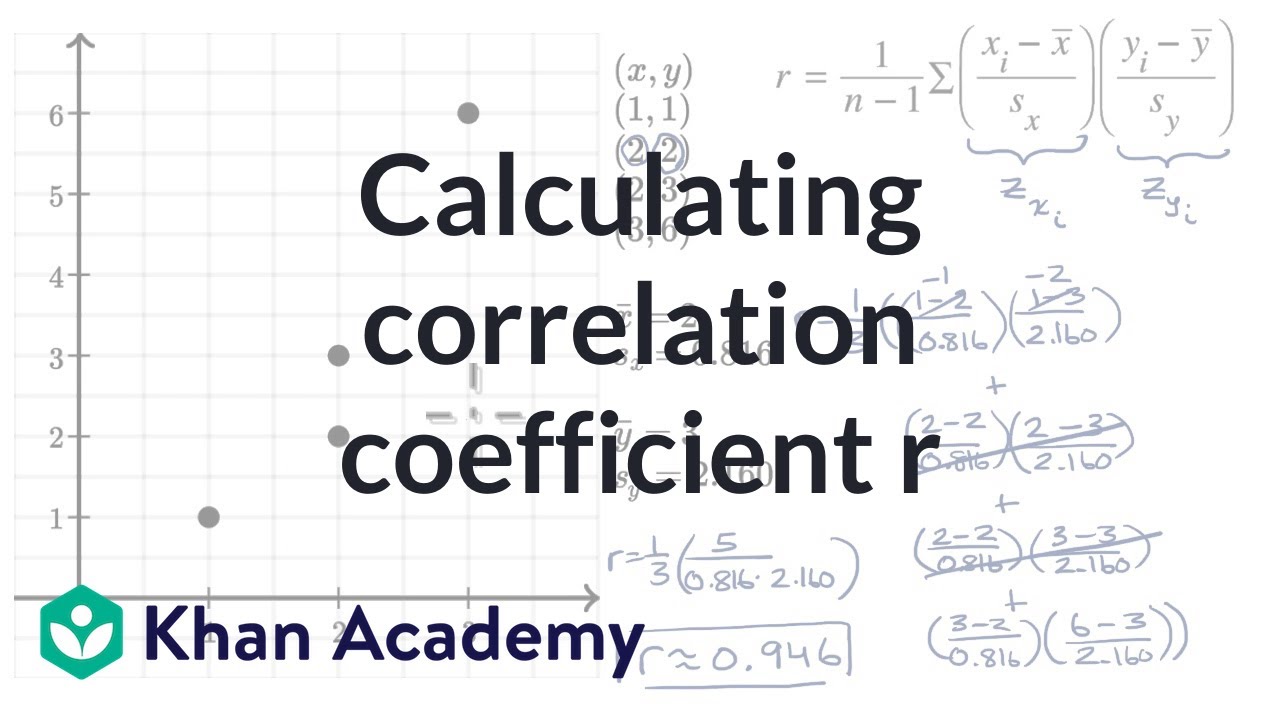
The second part of the script provides a detailed guide on calculating the correlation coefficient with a specific example. It walks through creating a table with columns for x, y, x*y, x², and y², followed by calculating their sums. The values for x range from 1 to 6, and y has corresponding values, leading to calculations of products, squares, and sums for these variables. With these sums, the video demonstrates how to plug values into the correlation coefficient formula, which involves sums of x, y, x*y, x², and y², adjusted by the sample size (n). The example carefully explains each step in the formula, culminating in the calculation of a high positive correlation coefficient, indicating a strong direct linear relationship between the variables x and y.
📊 Finalizing the Correlation Coefficient Calculation
The final segment concludes the calculation process, showcasing the arithmetic operations involved in applying the correlation coefficient formula. It highlights the computation of necessary intermediate values such as the product of sums, squares, and their differences, leading to the final correlation coefficient (r) value of 0.998. This result underscores a very strong positive linear relationship between the variables in the example. The video concludes by reiterating the importance of the correlation coefficient in understanding the linear relationship between two variables, emphasizing that a high positive r value signifies a direct correlation where increases in one variable correspond to increases in the other.
Mindmap
Keywords
💡correlation coefficient
💡linear relationship
💡positive correlation
💡negative correlation
💡sample data
💡calculation formula
💡slope
💡scatter plot
💡strong correlation
💡weak correlation
Highlights
Researchers developed a new method to sequence ancient DNA and recover genomes from samples up to 1 million years old.
The technique enables tracing human evolution and migration patterns further back than previously possible.
By comparing genomes across different time periods, scientists can study how viruses evolved over thousands of years.
The researchers demonstrated the effectiveness of the new method by sequencing the genome of a 560,000-year-old horse bone.
With higher-quality ancient DNA data, scientists can better understand how genes influence traits and disease susceptibility.
Climate change likely drove key evolutionary adaptations such as thicker hair and lighter skin as humans migrated out of Africa.
Ancient pathogen DNA provides insights into historical epidemics and how infectious diseases emerged over time.
The team developed new techniques to minimize contamination and damage to delicate ancient DNA samples.
By comparing Neanderthal and modern human genomes, researchers found evidence of interbreeding between the species.
With older DNA samples, scientists can piece together detailed evolutionary trees and anthropological histories.
The researchers highlighted the need to make ancient DNA sequencing more accessible to researchers worldwide.
Understanding genetic adaptations to historical changes in climate and disease can inform predictions about future human evolution.
The study demonstrates the power of paleogenomics to unravel mysteries about human prehistory and migration.
By tracing genetic changes over centuries, ancient DNA can reveal how humans adapted to new environments over time.
With older DNA samples, we gain insights into human diseases by studying their evolutionary origins and history.
Transcripts
Browse More Related Video
What is the Correlation Coefficient in Statistics?
Correlation and Coefficient of Determination in 3 Minutes

Linear Regression and Correlation - Introduction
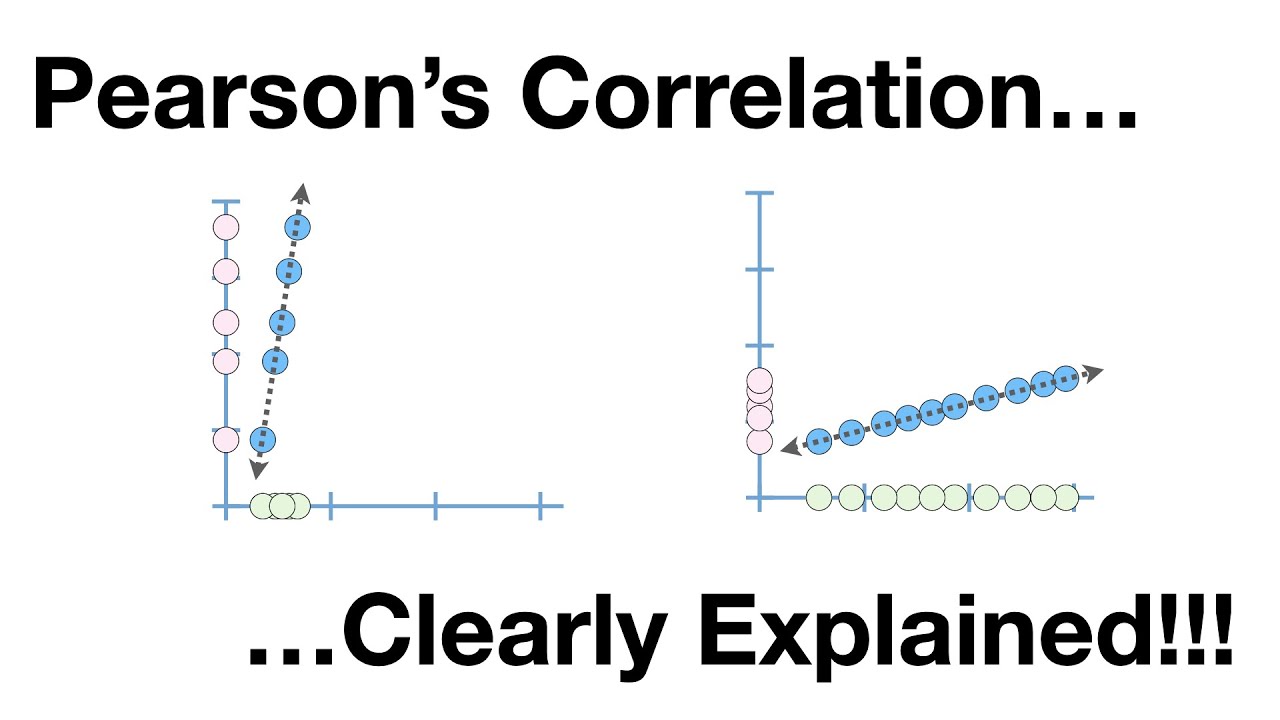
Pearson's Correlation, Clearly Explained!!!
Explanatory and Response Variables, Correlation (2.1)
Calculating correlation coefficient r | AP Statistics | Khan Academy
5.0 / 5 (0 votes)
Thanks for rating: