How To Calculate The Correlation Coefficient Using The Covariance Formula - College Statistics
TLDRThe video explains two methods to calculate the correlation coefficient between two variables X and Y. First, using the covariance formula, make a table of X, Y, X-Xbar, Y-Ybar, and their product. Calculate the covariance using the sum of the products divided by n-1. Then find the correlation coefficient using covariance over the product of the standard deviations of X and Y. The second method is to make a table of X, Y, XY, X^2, and Y^2. Use the formula with sums of XY, X, Y, X^2, and Y^2 over the square root of a denominator. Both give the same correlation coefficient result.
Takeaways
- 📊 The correlation coefficient between two variables X and Y can be calculated using the covariance divided by the product of their standard deviations.
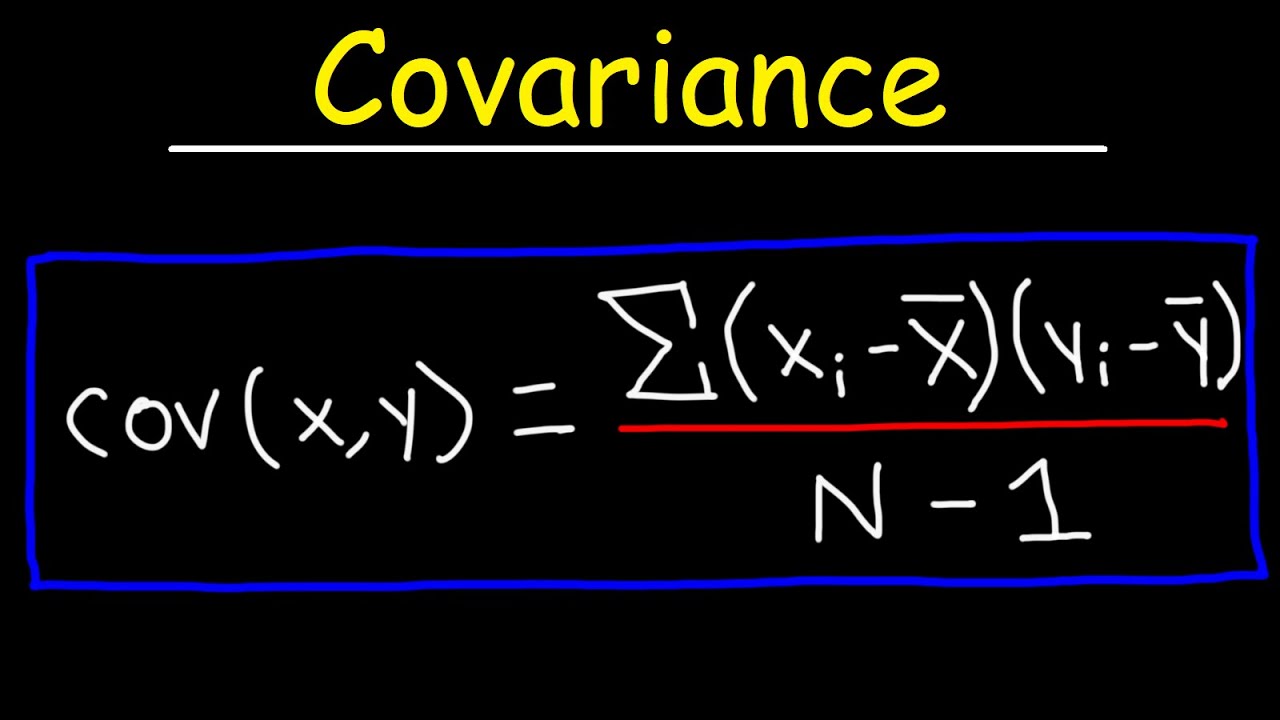
- 🔢 The covariance of X and Y is determined by the sum of the products of the differences between each X (and Y) value and their mean, divided by N-1 (sample covariance).
- 📐 Another method to calculate the correlation coefficient involves a formula using sums of X, Y, XY, X squared, and Y squared, adjusted by their counts (N).
- 📝 A detailed example demonstrates calculating covariance by creating a table with X and Y values, calculating their means, differences from means, and the product of these differences.
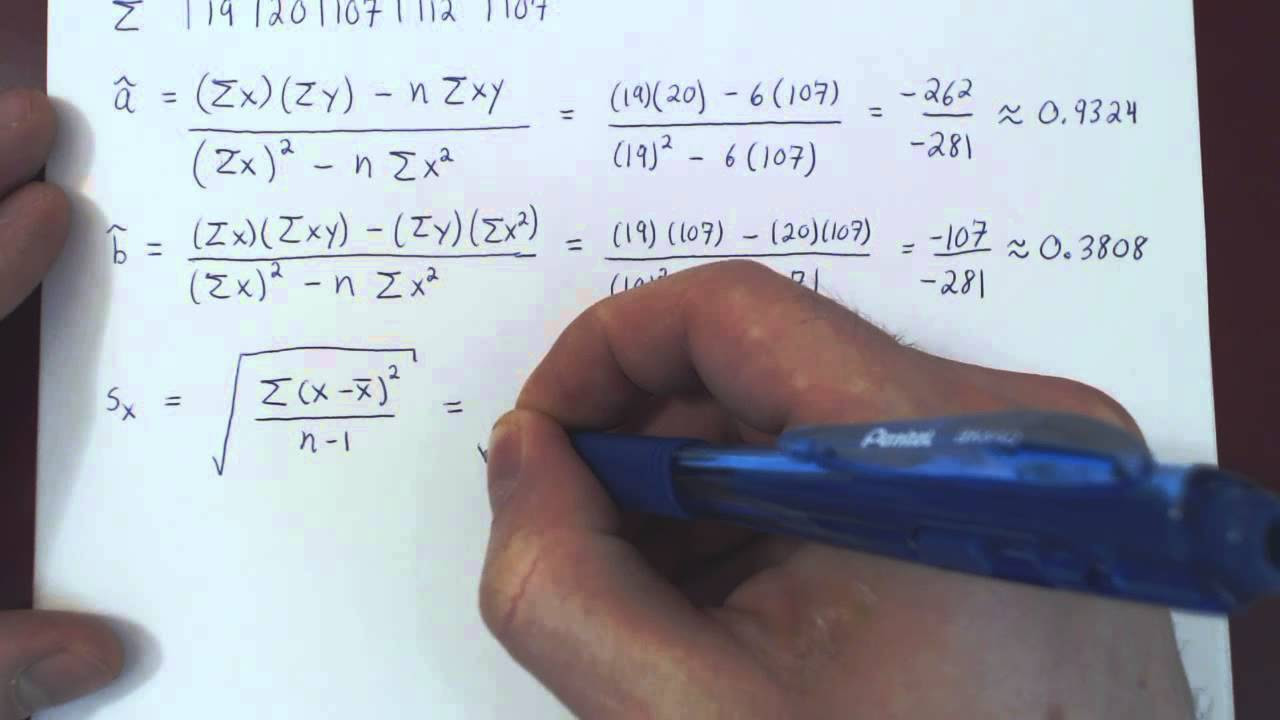
- 💡 The sample standard deviation for both X and Y is calculated using the sum of squared differences from the mean, divided by N-1, all under a square root.
- ✅ Two methods for calculating the correlation coefficient yield the same result, confirming the accuracy of the calculations.
- 📈 The first method involves direct calculation from covariance and standard deviations, while the second uses a more complex formula involving sums and squares of X and Y.
- 🧮 Detailed steps include calculating sums, means, and squared differences for both X and Y values, highlighting the mathematical process behind these statistical concepts.
- 🔍 The example uses a practical dataset to illustrate how to apply these formulas, making the abstract concepts more understandable through application.
- 📑 The process emphasizes the importance of accuracy in calculation and the consistency of results across different formulas for calculating the correlation coefficient.
Q & A
What are the two ways to calculate the correlation coefficient discussed in the video?
-The two ways are: 1) Using the covariance formula, and 2) Using the alternative summation formula provided.
What is the covariance formula to calculate the correlation coefficient?
-The covariance formula is: Correlation coefficient = Covariance(X,Y) / (Standard deviation of X * Standard deviation of Y)
What is the alternative summation formula to calculate the correlation coefficient?
-The alternative summation formula is: nΣXY - (ΣX)(ΣY)) / √(nΣX2 - (ΣX)2)(nΣY2 - (ΣY)2))
What are some of the steps involved in using the covariance method?
-Key steps include: calculating the means of X and Y, finding deviations from the means, multiplying the deviations, finding the sum of products, and plugging into the covariance formula.
What are some of the steps involved in using the summation formula method?
-Key steps include: multiplying X and Y, squaring X and squaring Y, finding the sums of each, and plugging the sums into the alternative summation formula.
Why is it useful to confirm the correlation coefficient using two methods?
-Using two methods helps validate the calculation and ensure accuracy of the final correlation coefficient.
What was the sample correlation coefficient calculated in the example?
-The sample correlation coefficient calculated was 0.9831 using both methods.
What is the purpose of finding the correlation coefficient?
-The correlation coefficient measures the strength and direction of the linear relationship between two variables.
What does a correlation coefficient value close to 1 indicate?
-A value close to 1 indicates a very strong positive linear correlation between the variables.
What does a correlation coefficient value close to -1 indicate?
-A value close to -1 indicates a very strong negative linear correlation between the variables.
Outlines
📊 Calculating Correlation Coefficient Using Covariance
This section introduces the calculation of the correlation coefficient between two variables, X and Y, using the formula that involves covariance and standard deviations of X and Y. The covariance formula is detailed, illustrating how to compute the sample covariance by considering the differences between each value and their respective means, divided by N-1. It further explains the process of setting up a table to organize X and Y values, their deviations from the mean, and the product of these deviations, culminating in the computation of covariance.
🔢 Detailed Steps for Calculating Covariance and Standard Deviations
This paragraph continues with the calculation process, focusing on the multiplication of deviations of X and Y from their means and summing these products to find the covariance of X and Y. It explains the formula for calculating sample standard deviation for both X and Y, involving squaring the deviations, summing them up, dividing by N-1, and taking the square root of the result. The detailed steps include squaring each deviation, summing these squares, and then calculating the standard deviation for both X and Y.
📈 Computing Correlation Coefficient from Covariance and Standard Deviations
This part describes the final step in calculating the correlation coefficient by dividing the previously calculated covariance by the product of the standard deviations of X and Y. It showcases the formula for the correlation coefficient as a division of covariance by the multiplication of standard deviations, leading to the actual computation of the coefficient. The narrative includes verifying the correlation coefficient using a different formula, which involves a new table setup for X, Y, their products, and squares, aiming to confirm the consistency of results.
✔️ Verification of Correlation Coefficient Calculation
The final section details the verification process for the correlation coefficient using an alternative formula that incorporates sums and squares of X and Y values, as well as their products. It meticulously walks through the calculation steps, including multiplying, summing, and applying the square root as necessary, to ensure accuracy and consistency with the initial calculation. This methodical approach confirms the correlation coefficient, emphasizing the reliability of both computational methods presented throughout the lesson.
Mindmap
Keywords
💡correlation coefficient
💡covariance
💡standard deviation
💡sample
💡mean
💡product
💡difference
💡formula
💡data
💡variables
Highlights
The discussion covers the philosophical foundations of human values and ethics in the context of AI development.
The presenter argues that AI systems should be designed with transparency and accountability to ensure alignment with human values.
Various ethical frameworks like utilitarianism, deontology, and virtue ethics are analyzed for their applicability to AI alignment.
The issue of bias in training data is raised as a key challenge in avoiding negative real-world impacts from AI systems.
It is proposed that AI developers have an ethical responsibility to consider the broad societal impacts of their work.
The presenter advocates for increased public discourse on AI ethics to inform policies and regulations.
The value alignment problem in AI safety is explained as the challenge of ensuring autonomous systems behave in accordance with human values.
Various techniques like inverse reinforcement learning and penalizing unintended side effects are discussed for value alignment in AI.
The speaker highlights the need for greater diversity and multidisciplinary collaboration in the AI ethics field.
It is emphasized that AI should be designed to augment and empower humans rather than replace them.
The possibility of general artificial intelligence exceeding human-level abilities raises ethical questions about human-AI relations.
The presenter concludes by calling for nuanced public policies on AI that encourage innovation while proactively addressing risks.
Overall, the talk provides a thoughtful overview of key issues in AI ethics and value alignment critical for responsible development.
It highlights the need for AI systems to remain transparent, accountable and aligned with evolving societal values and norms.
The presenter makes a persuasive case for proactive ethics-aware design, diverse collaboration, and dynamic governance of AI.
Transcripts
Browse More Related Video
How To Calculate The Covariance Between X and Y - Statistics
Linear Regression and Correlation - Example
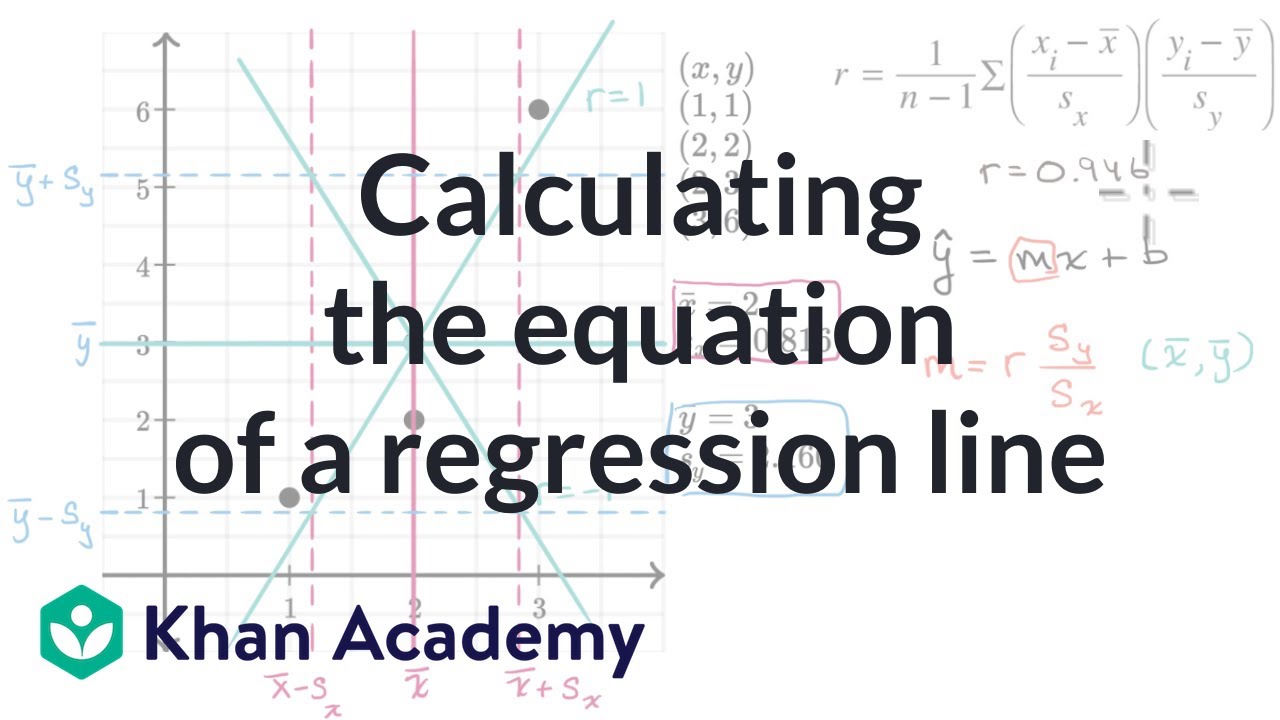
Calculating the equation of a regression line | AP Statistics | Khan Academy
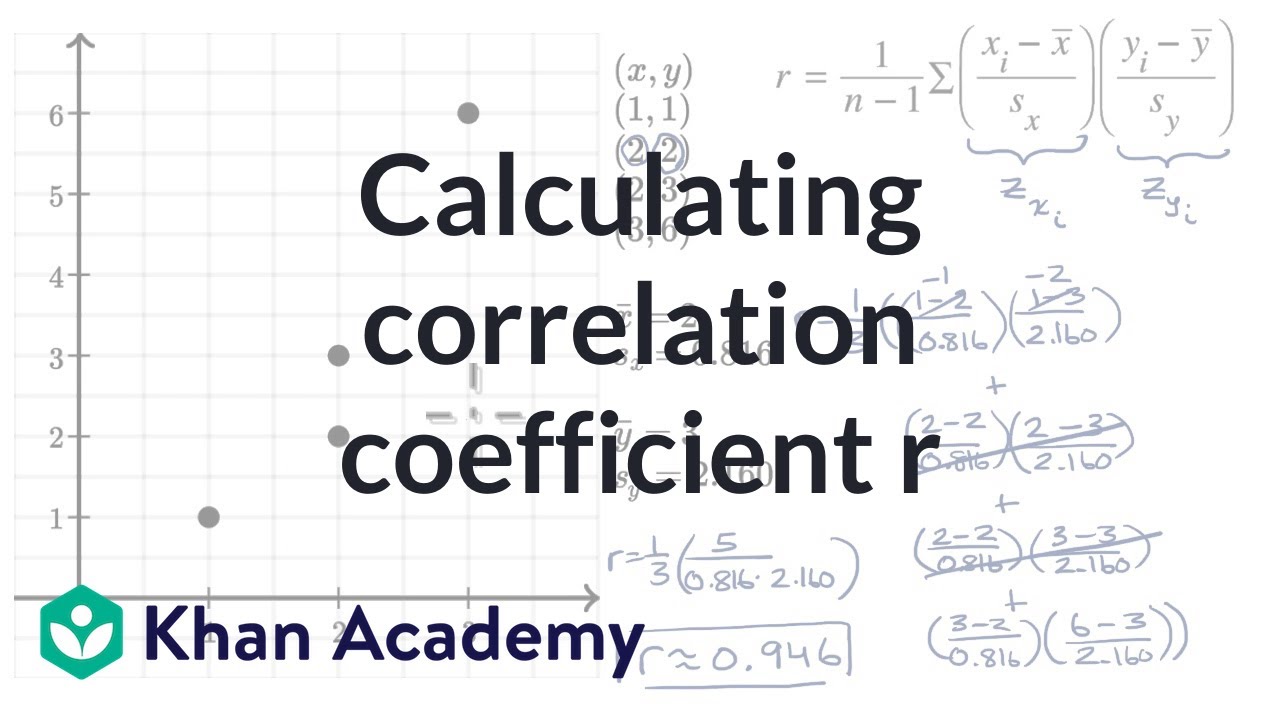
Calculating correlation coefficient r | AP Statistics | Khan Academy
Linear Regression Using Least Squares Method - Line of Best Fit Equation
Finding a Horizontal Line (y=k) to Divide a Region into Two Equal Parts Using Calculus
5.0 / 5 (0 votes)
Thanks for rating: