Calculus 1 Lecture 3.6: How to Sketch Graphs of Functions
TLDRThe video script is an in-depth tutorial on graphing functions, specifically focusing on using calculus to understand the shape of curves without a graphing calculator. It outlines a seven-step process starting from finding x and y intercepts, identifying vertical and horizontal asymptotes, applying the first and second derivative tests to find critical points and inflection points, and concluding with plotting the points on the graph. The instructor emphasizes the importance of understanding calculus concepts to interpret the behavior of the graph, such as increasing/decreasing intervals and concavity. The script provides a detailed walkthrough, including algebraic manipulation and limit calculations, to sketch accurate graphs of given functions, offering a comprehensive understanding of the subject.
Takeaways
- 📌 **Finding Intercepts**: To sketch a curve, first find the x and y intercepts by setting the function equal to zero for x-intercepts and plugging in x=0 for y-intercepts.
- 📈 **First Derivative Test**: Use the first derivative to identify critical points where the function could have relative maxima or minima by setting the derivative equal to zero.
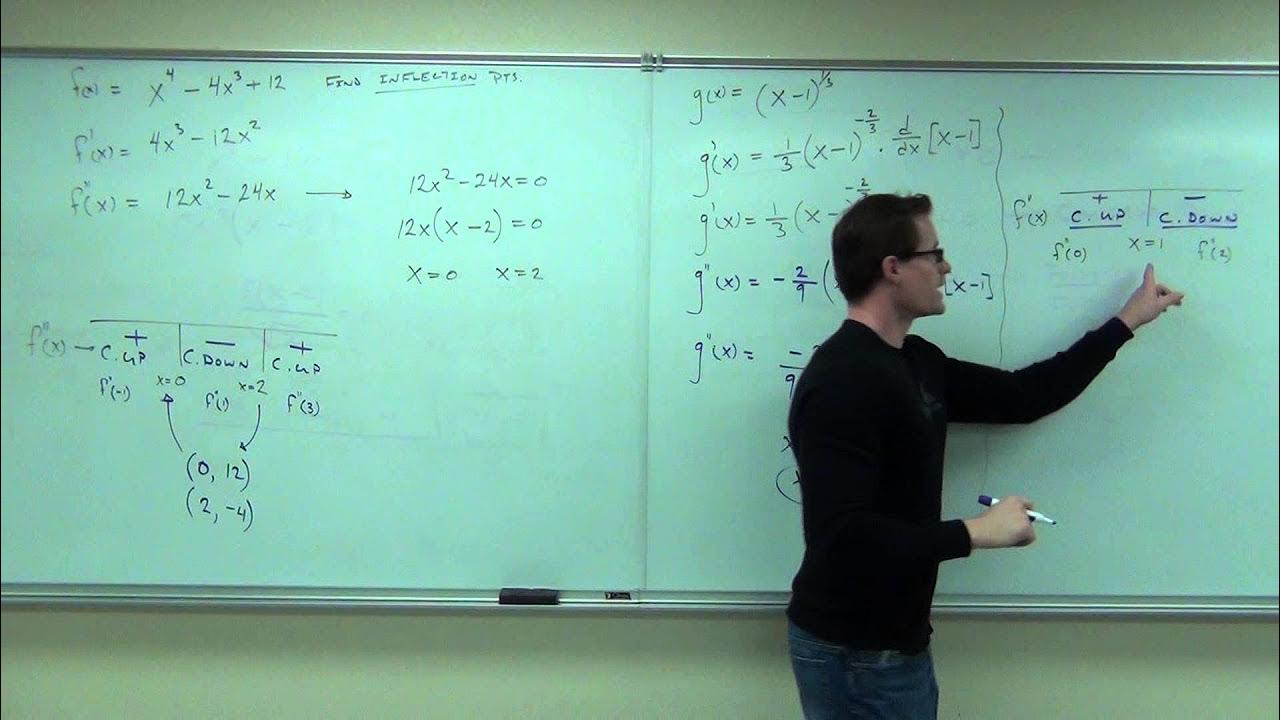
- 📉 **Second Derivative Test**: Apply the second derivative to find potential inflection points and to determine concavity, which indicates how the function curve changes direction.
- 🏞 **Concavity and End Behavior**: The second derivative also helps in understanding the concavity of the function and its behavior as it approaches positive or negative infinity.
- 🚫 **Avoiding Complex Factoring**: For y-intercepts, only factor if it's a quadratic or lower degree equation or already factored; cubics and higher degrees typically require simpler methods.
- 🔍 **Identifying Asymptotes**: For rational functions, determine vertical and horizontal asymptotes, which are critical for graphing and understanding the function's limitations.
- 📋 **Creating a Table**: Construct a table that includes the first and second derivative information to visualize the graph's behavior across different intervals.
- 🔑 **Critical Points**: Plug critical numbers from the first and second derivative tests into the original function to find points of interest like relative maxima, minima, and inflection points.
- 📐 **Graphing Rational Functions**: When graphing rational functions, pay special attention to asymptotes, as they significantly influence the shape and limitations of the graph.
- 🤔 **Understanding Behavior**: The behavior of the function near vertical asymptotes is crucial; the function will never cross these lines, which act as boundaries.
- ✅ **Completing the Graph**: After identifying all the necessary points and understanding the concavity and end behavior, sketch the curve to reflect all these properties for a complete graph.
Q & A
What is the first step in sketching a curve without a graphing calculator?
-The first step is to find as many intercepts as possible, specifically the x and y intercepts, which give an approximation of where the curve crosses the axes.
How do you find the x-intercepts of a curve?
-To find the x-intercepts, set the equation of the curve equal to zero and solve for x. This will give you the points where the curve crosses the x-axis.
What is the second step in the process of sketching a curve?
-The second step is to find any asymptotes, which are lines that the curve approaches but never actually reaches. This step is only applicable to rational functions.
How do you find the y-intercept of a curve?
-To find the y-intercept, substitute x with zero in the equation of the curve and solve for y. This gives the point where the curve crosses the y-axis.
What does the first derivative test help you determine?
-The first derivative test helps you find critical numbers, which are points where the slope of the curve is zero, indicating potential relative maxima or minima.
What is the purpose of the second derivative test?
-The second derivative test is used to determine the concavity of the curve and to find potential inflection points, which are points where the curve changes concavity.
How do you find vertical asymptotes of a rational function?
-Vertical asymptotes are found by setting the denominator of the rational function equal to zero and solving for x, provided you cannot simplify the fraction to remove the denominator.
What are the conditions for a hole to exist in a rational function?
-A hole exists in a rational function when the denominator equals zero and the numerator does not, allowing the fraction to be simplified, thus the point is removable and represents a hole in the graph.
How do you determine the end behavior of a rational function as x approaches positive or negative infinity?
-To determine the end behavior, take the limit of the rational function as x approaches positive or negative infinity. If the degree of the polynomial in the numerator is less than the degree in the denominator, the limit is zero.
What does the sign of the first derivative tell you about the curve?
-The sign of the first derivative indicates whether the curve is increasing (positive) or decreasing (negative) at a particular point.
How does the sign of the second derivative relate to the concavity of the curve?
-The sign of the second derivative indicates the concavity of the curve; if it's positive, the curve is concave up, and if it's negative, the curve is concave down.
What is the significance of making a table that includes the first and second derivative information?
-The table provides a visual representation of the curve's behavior, showing intervals of increase and decrease, as well as intervals of concavity up and down, which helps in sketching the curve without a graphing calculator.
Outlines
📈 Sketching Curves with Intercepts and Calculus
The paragraph introduces the process of sketching curves using various mathematical tools. It emphasizes the importance of finding x and y intercepts, understanding extrema (relative maxima and minima), and using concavity to visualize the curve's shape without a graphing calculator. The speaker proposes an example to illustrate the steps involved in graphing a curve, highlighting the significance of calculus in comprehending the shape of these graphs.
🔍 Finding Intercepts and Rational Function Considerations
This section delves into the specifics of finding x and y intercepts by setting the equation equal to zero for x intercepts and substituting x with zero for y intercepts. It also discusses the process for rational functions, including identifying vertical and horizontal asymptotes, and the difference between them and holes in the function. The paragraph clarifies that the second step of finding asymptotes applies only to rational functions, unlike polynomials.
📚 Applying Calculus: Derivatives and Inflection Points
The paragraph explains the application of calculus to sketch curves by using the first and second derivative tests. It details how the first derivative test helps find critical numbers that indicate where the function increases or decreases, while the second derivative test identifies concavity and potential inflection points. The process involves creating a table that summarizes the findings from these derivative tests to visualize the graph's behavior.
📝 Completing the Graph with Points and Labeling
The section focuses on the final steps of graphing, which include identifying and plotting all necessary points derived from the intercepts, critical numbers, and inflection points. It also covers how to label these points on the graph, using dashed lines to indicate relative maxima and minima, and noting inflection points with an 'IP' label. The importance of accuracy in plotting and labeling is emphasized for a clear understanding of the graph's features.
🤔 Reflecting on the Process and Rational Functions
This part of the script recaps the steps taken to find x and y intercepts, apply the first and second derivative tests, and use the information to graph a polynomial function. It also addresses the upcoming challenge of graphing rational functions, which are more complex due to the presence of asymptotes and the intricacies of their derivatives. The speaker reassures learners that they will proceed step by step through the process.
🧮 Navigating Algebraic and Limiting Behaviors
The paragraph discusses the process of finding x and y intercepts for rational functions, emphasizing the algebraic approach to determine these values. It also addresses the concept of vertical asymptotes, which occur when the denominator of a rational function equals zero, and the use of limits to find horizontal asymptotes. The speaker guides learners through the calculations, highlighting the importance of limits in understanding the function's behavior as x approaches positive or negative infinity.
📉 Derivatives and Their Implications for Graphing
This section details the process of taking the first and second derivatives of a rational function to determine its increasing/decreasing behavior and concavity. The first derivative identifies critical points where the function could potentially change direction, while the second derivative helps find inflection points where the curve's concavity changes. The speaker simplifies the derivatives and uses them to explain how they inform the graph's overall shape.
📌 Identifying Inflection Points and Graphing Rational Functions
The paragraph focuses on using the second derivative to find potential inflection points and discusses the importance of these points in understanding the graph's concavity. It also emphasizes the need to test specific points in each interval to determine the graph's behavior. The speaker then guides learners through the process of creating a table that consolidates information from the first and second derivative tests, which aids in plotting the function's graph.
🤓 Plotting Points and Graphing the Function
The final paragraph of the script instructs learners on how to use the information from the first and second derivative tests to find specific points that define the graph of the function. It explains that once these points are identified, they can be plotted on the graph to visualize the function's behavior between the vertical and horizontal asymptotes. The speaker also suggests that sometimes the graph can be inferred by considering the behavior of the function at the asymptotes, even without explicitly plotting all points.
📐 Finalizing the Graph and Encouraging Independent Problem Solving
The speaker concludes the script by summarizing the steps taken to graph the rational function and emphasizes the importance of considering the function's behavior at the asymptotes. They encourage learners to practice graphing by considering the first derivative and the asymptotes, which can often lead to a correct graph without needing to plot every point. The speaker also acknowledges the complexity of the process and the potential for mistakes, encouraging learners to be careful with their calculations.
Mindmap
Keywords
💡Intercepts
💡Extrema
💡Concavity
💡Derivative Test
💡Rational Functions
💡Asymptotes
💡Inflection Points
💡First Derivative
💡Second Derivative
💡Table of Analysis
💡Graph Sketching
Highlights
Section 3.6 focuses on sketching curves using intercepts, extrema, and concavity to approximate graphs without a calculator.
To find x-intercepts, set the equation equal to zero and solve for x, identifying where the curve crosses the x-axis.
Y-intercepts are found by substituting x with zero in the equation, revealing the point where the curve crosses the y-axis.
For rational functions, identify asymptotes and holes by analyzing the behavior of the function as it approaches vertical asymptotes.
The first derivative test helps locate relative maxima and minima by finding critical points where the derivative is zero or undefined.
The second derivative test is used to determine concavity and potential inflection points on the curve.
A table summarizing the first and second derivative information provides a visual representation of the graph's behavior.
The process of graphing involves six steps: finding intercepts, applying the first and second derivative tests, creating a table, identifying points, and plotting the graph.
When graphing rational functions, it is crucial to find vertical and horizontal asymptotes, which provide key information for the graph's shape.
The quotient rule is used to find the derivatives of rational functions, which are essential for the first and second derivative tests.
The sign of the first derivative indicates whether the function is increasing or decreasing in a given interval.
The sign of the second derivative determines the concavity of the function, indicating whether it is concave up or down.
By plotting the x-intercepts, y-intercepts, and points derived from the first and second derivative tests, a rough graph of the function can be sketched.
The process of graphing rational functions involves understanding the behavior of the function near asymptotes and using this information to shape the graph.
The lecture demonstrates how to graph a polynomial function step by step, providing a clear method for students to follow.
The importance of accurately calculating and interpreting the first and second derivatives cannot be overstated, as they are key to understanding the graph's features.
The lecture concludes with a comprehensive example that ties together all the steps of graphing, reinforcing the process for students.
Transcripts
Browse More Related Video
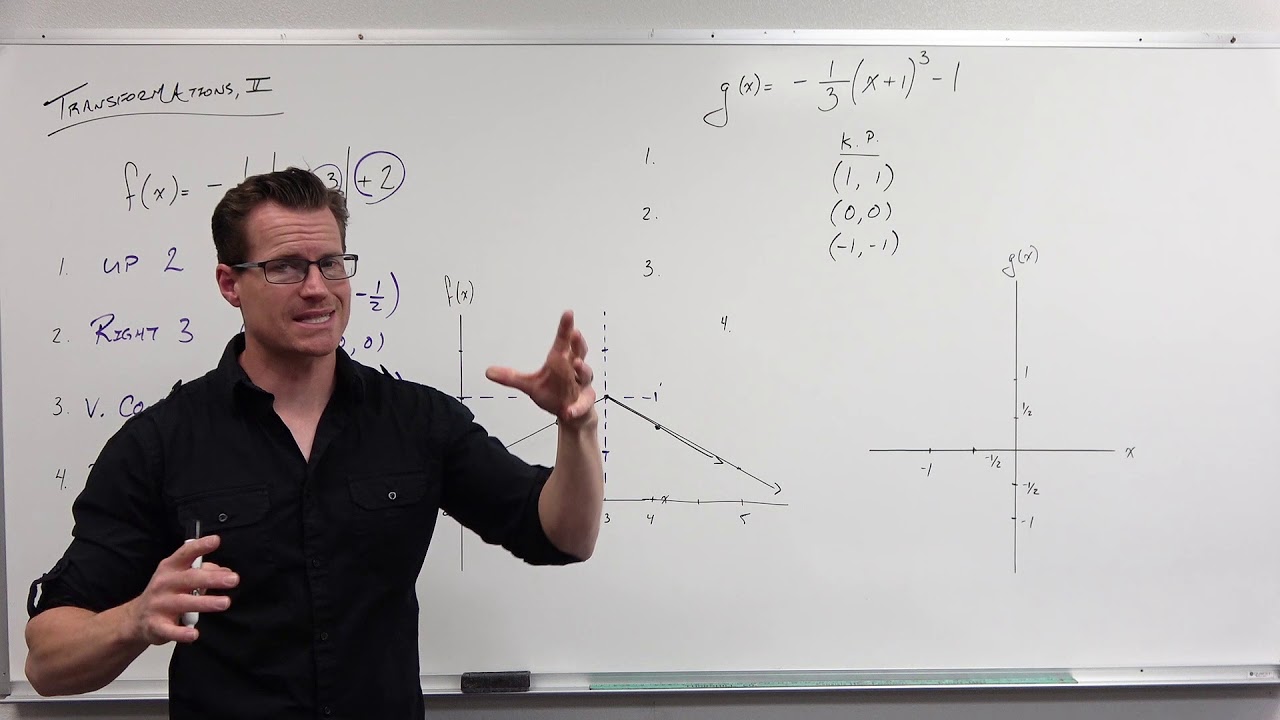
How to Graph with Transformations (Precalculus - College Algebra 15)
Graphing using derivatives | Derivative applications | Differential Calculus | Khan Academy
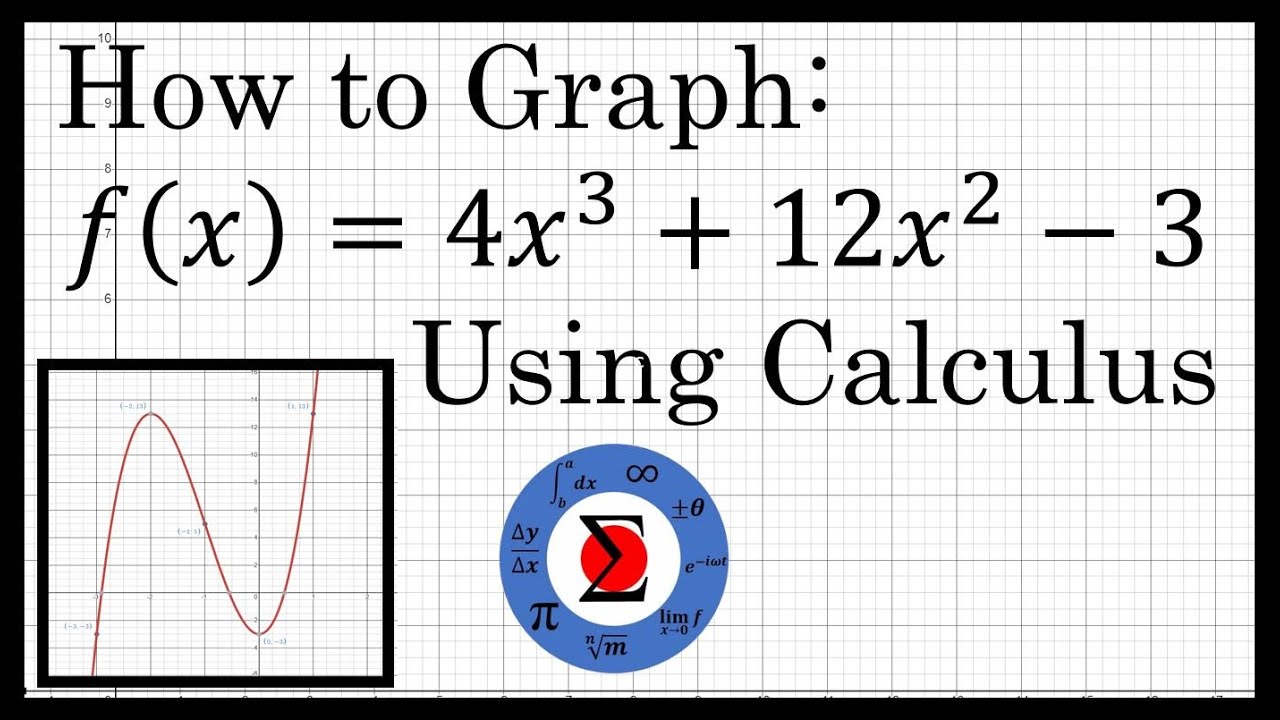
Graphing a Polynomial Equation :: Curve Sketching Using Calculus
Business Calculus - Math 1329 - Section 3.3 - Curve Sketching
Calculus 1 Lecture 3.4: The Second Derivative Test for Concavity of Functions
AP Calculus AB 2012 Multiple Choice (calculator) - Questions 76 - 92
5.0 / 5 (0 votes)
Thanks for rating: