Matched or Paired Samples T-Test - Hypothesis Testing
TLDRThis video tutorial guides viewers through the process of analyzing the effectiveness of a weight loss program using a paired sample t-test. By comparing the before and after weights of 10 subjects, the video demonstrates how to calculate the mean difference, standard deviation, and construct hypotheses. Using a significance level of 5%, it walks through the calculation of the critical t-value, and the comparison of the calculated t-value to determine the program's effectiveness. The video concludes by constructing a confidence interval, reinforcing the statistical evidence that the weight loss program is effective in reducing weight, thus providing viewers with a practical application of statistical analysis in real-world scenarios.
Takeaways
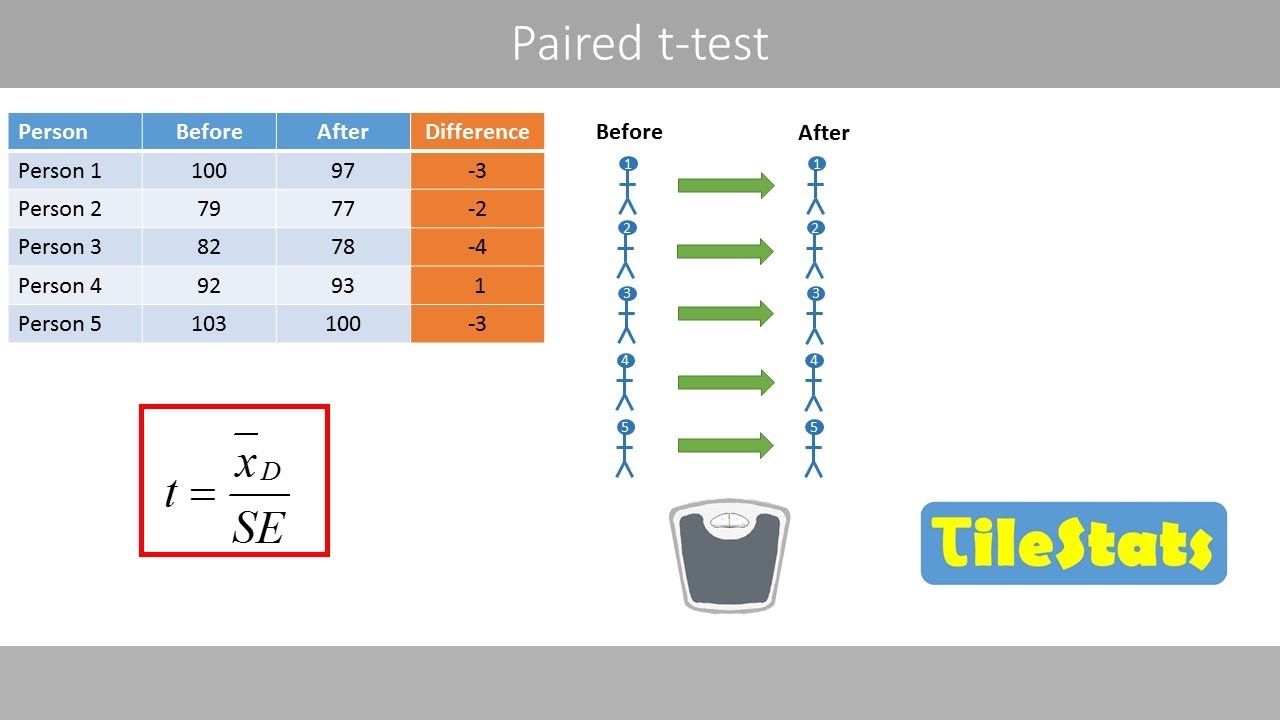
- 😀 The video explains how to solve problems with matched or paired sample data using a weight loss program example.
- 📊 The data consists of before and after weights of 10 subjects in the program.
- 🤔 The goal is to determine if the program is effective at reducing weight using a t-test.
- 💡 The differences between before and after weights are calculated first.
- 📈 The sample mean and standard deviation of the differences are then calculated.
- 📜 The null and alternative hypotheses are stated based on the goal of the test.
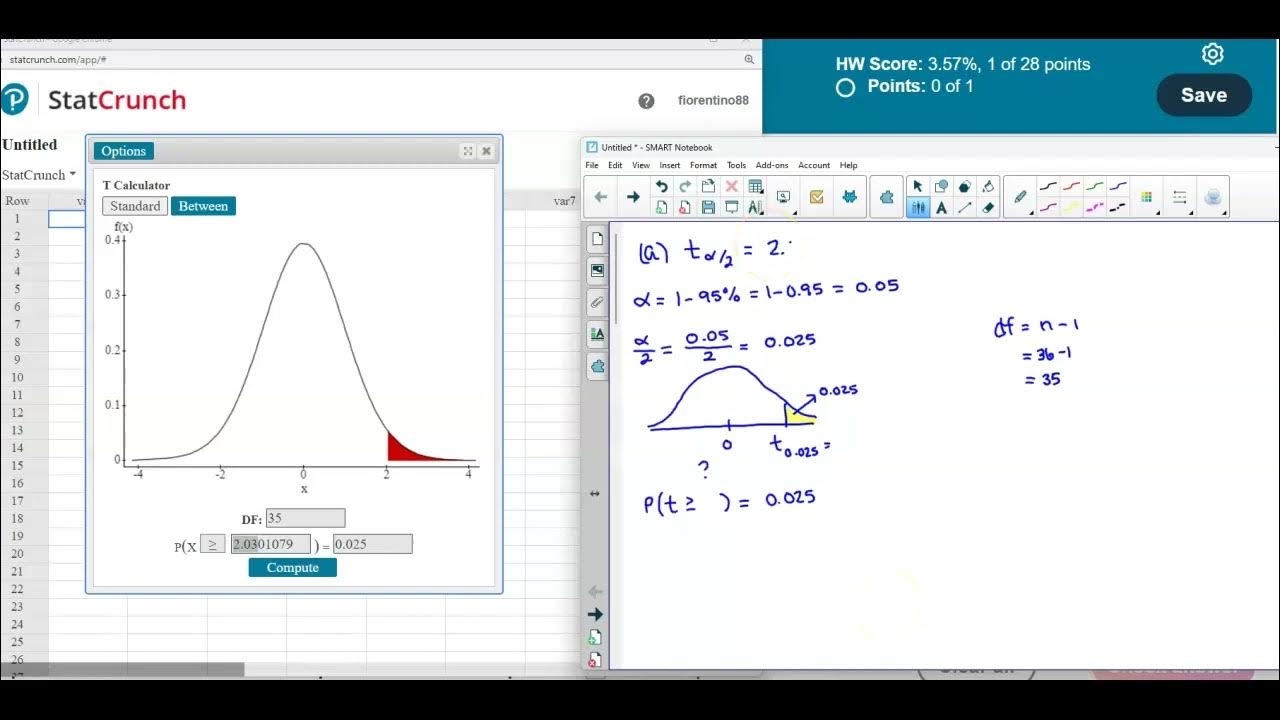
- 🔍 The critical t value is looked up in a t-distribution table based on the degrees of freedom and alpha.
- 🧮 The calculated t value is compared to the critical value to determine if the null hypothesis should be rejected.
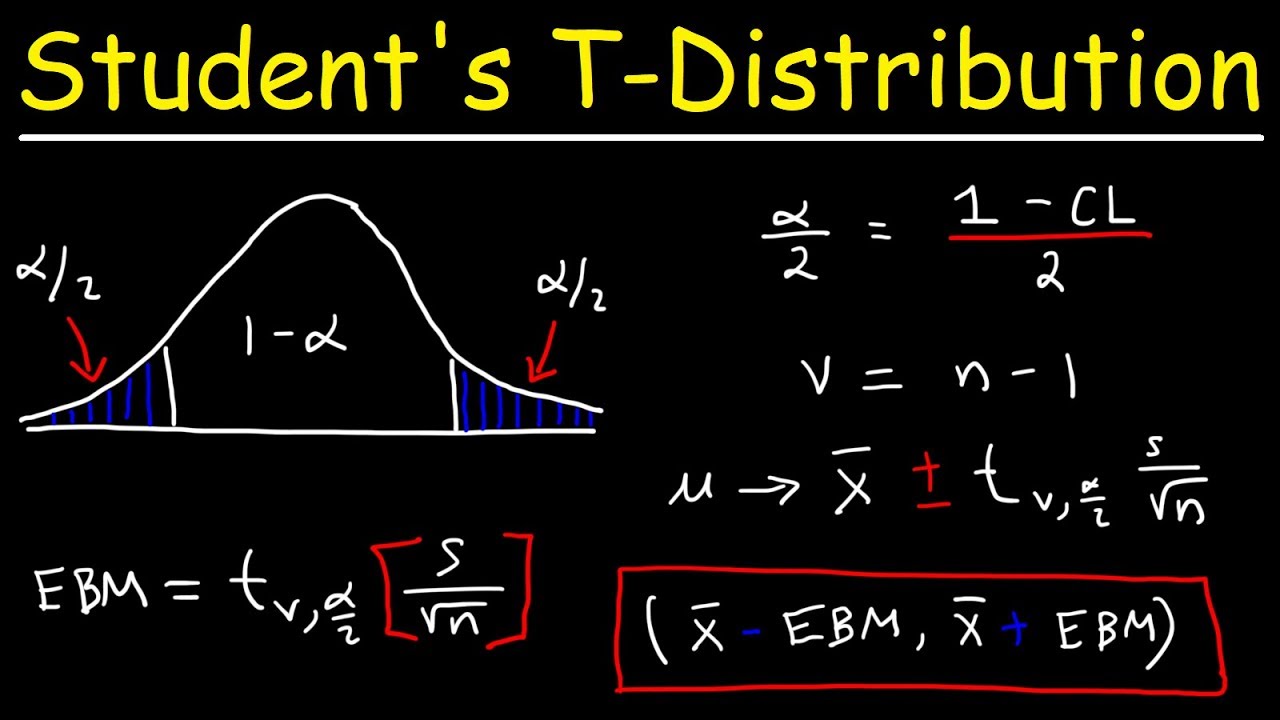
- 📊 A confidence interval is constructed around the sample mean difference.
- 🎓 The margin of error is determined, and conclusions about the effectiveness of the program are made.
Q & A
What is the purpose of the study described in the video?
-The purpose is to determine if a specific weight loss program is effective at reducing weight.
How many subjects participated in the weight loss program study?
-There were 10 subjects that participated.
What data was collected from the subjects?
-The before and after weights of the 10 subjects were collected.
What is the null hypothesis and alternative hypothesis for this study?
-The null hypothesis is that the mean difference is equal to or greater than 0. The alternative hypothesis is that the mean difference is less than 0.
How is the mean difference and standard deviation of the differences calculated?
-The mean difference is calculated by finding the difference between the before and after weights for each subject, summing those differences, and dividing by the number of subjects. The standard deviation is calculated using the STDEV.S function in Excel on the list of differences.
What test statistic is used to analyze the data?
-A left-tailed t-test is used since the alternative hypothesis states the mean difference is less than 0. The test statistic is the sample mean difference minus 0 divided by the standard error.
What is the conclusion from the statistical test?
-Since the calculated t statistic falls in the rejection region, we reject the null hypothesis. There is evidence that the weight loss program is effective at reducing weight.
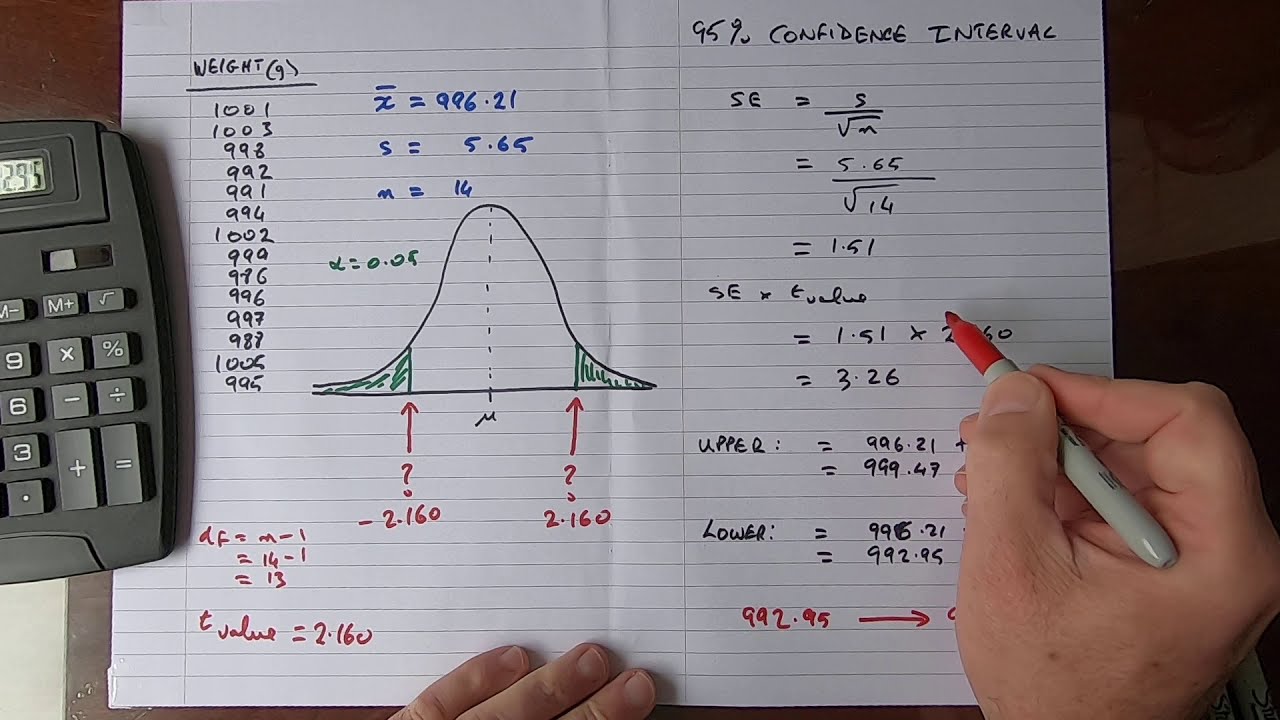
What is the confidence interval calculated?
-The 95% confidence interval is -20.65 to -5.55. This means we are 95% confident the true mean difference lies within that interval.
What is the margin of error for the study?
-The margin of error is 7.55.
What sample size would be needed to reduce the margin of error?
-A larger sample size would reduce the margin of error. For example, with a sample size of 25 instead of 10, the margin of error would decrease to about 5.9.
Outlines
😀 Calculating weight differences
The paragraph describes calculating the difference in before and after weights for each of the 10 subjects in a weight loss program study to determine the program's effectiveness. It steps through subtracting the after weight from the before weight for each subject to populate a difference column. It also states the null and alternative hypotheses.
😊 Calculating mean and standard deviation
The paragraph discusses calculating the sample mean and standard deviation of the weight differences using formulas initially then shows how to simplify the calculation using Excel. It highlights that the standard deviation helps determine the standard error to then calculate a test statistic.
📈 Analyzing results and drawing conclusions
The paragraph analyzes the test statistic calculated from the mean difference and standard error and compares it to the critical t-value to determine that the null hypothesis can be rejected. It then constructs a 95% confidence interval for the true mean difference and explains how this also rejects the null. Finally, it states the margin of error.
Mindmap
Keywords
💡Matched sample
💡Significance level
💡Null hypothesis
💡Alternative hypothesis
💡Mean difference
💡Standard deviation
💡Left-tailed test
💡Degrees of freedom
💡Confidence interval
💡Margin of error
Highlights
The development of a new model that combines supervised and unsupervised learning could lead to more accurate and powerful AI systems.
Using causality principles in machine learning models enables better understanding of cause-effect relationships and more robust predictions.
Applying transfer learning to NLP models allows building high-performing systems with less data by leveraging knowledge from pretrained models.
Explainable AI techniques such as LIME and SHAP can increase transparency and trust in AI systems by providing insights into model predictions.
New computational imaging methods using deep neural networks allow reconstructing high-quality 3D images from limited input data.
Advances in few-shot learning enable training models to generalize from limited labeled data, reducing data annotation costs.
Reinforcement learning shows promise for optimizing recommendations, logistics, robotics, and other sequential decision-making tasks.
Multimodal learning integrates data from diverse modalities like text, images, audio, video for more comprehensive analysis.
New machine learning compilers and hardware accelerators enable faster and more efficient model training and inference.
Differential privacy techniques allow gathering insights from data while preserving individual privacy.
Cognitive AI assistants incorporate natural language, knowledge representation, reasoning and learning to understand user needs.
Advances in neural architecture search automate model design, reducing time and costs of developing high-performing models.
Federated learning enables collaborative model training across decentralized data while maintaining data privacy.
New benchmark datasets spur progress by enabling standardized evaluation and comparison of AI systems.
Addressing algorithmic bias, transparency, and ethical AI principles is crucial for building trustworthy AI systems.
Transcripts
Browse More Related Video
The paired t-test | explained with a simple example

Finding and interpreting a confidence interval for a population mean (σ unknown)
How To...Calculate the Confidence Interval for a Sample

SPSS (9): Mean Comparison Tests | T-tests, ANOVA & Post-Hoc tests
Math 14 HW 7.2.5-T Find critical t value, margin of error & confidence interval for population mean.
Student's T Distribution - Confidence Intervals & Margin of Error
5.0 / 5 (0 votes)
Thanks for rating: