CH403 4 Statistics
TLDRThe transcript discusses the application of statistics in analytical chemistry, focusing on Gaussian distributions, mean, standard deviation, and confidence intervals. It explains how random errors lead to a bell curve and the importance of these statistical measures in determining the reliability of experimental results. The concept of a calibration curve and the method of least squares are introduced, emphasizing their role in comparing measurements against known quantities. The summary highlights the significance of statistical analysis in assessing the accuracy and precision of chemical measurements.
Takeaways
- 📊 Understanding Gaussian distributions is crucial in analytical chemistry as they represent the natural clustering of data points around the mean in the absence of systematic errors.
- 🔢 The mean (average) and standard deviation are fundamental statistical measures that describe a dataset's central tendency and dispersion.
- 🌐 The more measurements taken, the smaller the standard deviation becomes, indicating increased confidence in the proximity of the sample mean to the true population mean.
- 📈 The standard deviation allows us to estimate the probability of data points falling within a certain range of the mean, following the normal distribution curve.
- 📝 Variance and relative standard deviation are additional statistical tools that help express the dispersion of data points and the uncertainty in the mean.
- 🔍 The Z-score (standard scores) is a way to compare individual data points to the mean in terms of standard deviations, which is useful for probability and statistical significance.
- 🎯 The concept of confidence intervals provides a range within which we can be certain the true population parameter lies, with a given level of confidence.
- 🚦 Student's T is a statistical tool used to calculate confidence intervals and make comparisons between sample means when the population parameters are unknown.
- 🔎 Outliers can be identified and potentially removed from a dataset if they significantly deviate from the rest of the data points, using tests like the Grubbs' test.
- 📊 Calibration curves are used in analytical chemistry to compare measurements against known quantities, typically employing the method of least squares to find the best-fit line.
- 🔑 The r-squared value indicates the goodness of fit for a calibration curve, with values closer to 1 suggesting a better fit and increased confidence in the predictive power of the curve.
Q & A
What is a Gaussian distribution?
-A Gaussian distribution, also known as a normal distribution or bell curve, is a smooth, bell-shaped distribution that forms from a large number of randomly distributed data points clustered around the mean. It is a common pattern that emerges when an experiment is repeated many times with random errors, in the absence of systematic errors.
How is the mean calculated in statistics?
-The mean, also known as the arithmetic mean or average, is calculated by summing all the measured values (X) and dividing by the number of measurements (n). Mathematically, it is represented as x-bar (μ) = ΣX / n.
What does standard deviation measure in a data set?
-The standard deviation (s) measures how closely the data points in a data set are clustered around the mean. It quantifies the amount of variation or dispersion in the data. A smaller standard deviation indicates that the data points are more closely clustered around the mean, suggesting a higher degree of consistency in the data set.
How is the standard deviation related to the degrees of freedom in statistics?
-The standard deviation is related to the degrees of freedom (n - 1), which is the quantity used in the calculation of the sample standard deviation. As the number of data points (n) increases, the degrees of freedom also increase, leading to a smaller standard deviation. This reflects the idea that with more data points, we can be more confident that our average is close to the true average value.
What is the significance of the z-score in statistical analysis?
-The z-score represents the number of standard deviations a data point is away from the mean in a standard normal distribution (Gaussian distribution). It is used to compare individual data points with the overall distribution and to calculate the probability of observing a data point within a certain range of the mean. The z-score is a useful tool for understanding the likelihood of a particular data point occurring in the context of the entire data set.
How does the uncertainty in the mean of a sample decrease with an increase in the number of measurements?
-The uncertainty in the mean of a sample decreases as the inverse of the square root of the number of measurements (n). This means that if you want to decrease the uncertainty by a factor of two, you must take four times as many measurements, and to decrease it by a factor of ten, you must take a hundred times as many measurements. However, there are diminishing returns, as the law of diminishing returns suggests that at some point, the increase in the number of measurements may not significantly improve the precision of the mean.
What is a confidence interval and how is it used in statistical analysis?
-A confidence interval is a range within which we are certain, at a certain level of confidence (e.g., 90%, 95%), that the true population mean lies. It is calculated using the sample mean, the standard deviation of the sample, and a t-value associated with the desired level of confidence and the degrees of freedom. The confidence interval provides a way to quantify the uncertainty in our estimate of the population mean based on a sample of data.
How does a t-test help in comparing two means to determine if there is a statistically significant difference between them?
-A t-test calculates the probability that the observed difference between two means is due to random error. If this probability (p-value) is less than a predetermined threshold (e.g., 5% for a 95% confidence level), we reject the null hypothesis that there is no difference between the two means, concluding that there is a statistically significant difference. The t-test helps us determine whether the observed differences are likely to be real or simply due to random variation in the data.
What is the Grubbs test for an outlier and how is it used?
-The Grubbs test for an outlier is a statistical test used to determine if a single data point in a data set is an outlier. It works by calculating a G value for the suspected outlier, which is the absolute value of the difference between the outlier and the mean, divided by the standard deviation. If the calculated G value is greater than the critical G value from a table, the data point is considered an outlier and can be discarded. If not, the data point is assumed to be part of the same population as the other values.
How is a calibration curve used in chemical analysis?
-In chemical analysis, a calibration curve is used to compare measurements of an unknown sample against measurements of known quantities of the analyte. The method of least squares is used to draw a straight line, or the line of best fit, through the data points for the standards. This line represents the relationship between the independent variable (e.g., concentration of the standard) and the dependent variable (e.g., intensity of a color or peak area). The calibration curve allows for the accurate determination of the concentration of the analyte in an unknown sample based on its measured response.
What does the r-squared value indicate in the context of a calibration curve?
-The r-squared value, or coefficient of determination, indicates how well the data points fit the trend line of the calibration curve. It is a measure of the proportion of the variance in the dependent variable that is predictable from the independent variable. An r-squared value closer to 1 suggests that the data points are closely aligned with the trend line, indicating a high degree of correlation and a reliable fit of the calibration curve.
Outlines
📊 Introduction to Statistical Concepts in Analytical Chemistry
This paragraph introduces the use of statistics in analytical chemistry, assuming a basic understanding of statistical concepts. It emphasizes the importance of Gaussian distributions, also known as normal distributions or bell curves, which result from repeated experiments with random errors. The speaker explains the concept of a histogram and how it represents data clustered around the mean. The paragraph also introduces the calculation of the mean (average) and standard deviation, highlighting their significance in understanding the true mean and the degree of confidence in experimental results. The importance of a sufficient number of experiments to estimate population parameters is discussed, as well as the concept of degrees of freedom.
📈 Symbols and Population vs Sample Statistics
This paragraph delves into the notation used for population and sample statistics. It explains that the population mean is symbolized by mu (μ) and the population standard deviation by sigma (σ). In contrast, sample statistics are represented by x-bar (𝑋̄) and s. The speaker clarifies that due to practical limitations, chemists rarely deal with the entire population and thus focus on sample statistics. The paragraph also touches on the importance of representative sampling and introduces the concepts of variance and relative standard deviation, as well as how to express the mean and standard deviation in terms of significant figures.
🎯 Probability and the Normal Distribution
This section discusses the relationship between standard deviation and probability within a normal distribution. It explains the empirical rule, which states that about 68% of the data lies within one standard deviation of the mean, 95% within two, and 99.7% within three. The concept of z-scores and how they relate to the normal distribution curve is introduced, allowing for the calculation of probabilities associated with specific ranges of data points. The paragraph also encourages the use of z-tables for determining these probabilities and discusses the concept of the mean of a sample set being closer to the population mean than individual data points due to the reduction of random errors.
🔍 Confidence Intervals and Student's T-Distribution
This paragraph introduces confidence intervals as a statistical tool for estimating the population mean based on sample data. It explains that confidence intervals are calculated using the sample mean, the standard deviation, and a T-value, which depends on the number of samples and the desired level of confidence. The paragraph also discusses the concept of Student's T-distribution and how it differs from the normal distribution. The use of T-tables to find the appropriate T-value for a given confidence level and degrees of freedom is highlighted. The paragraph emphasizes that while we cannot prove the null hypothesis, we can collect evidence to reject it in favor of the alternative hypothesis.
🧪 Analytical Applications of Statistics in Chemistry
This section applies statistical concepts to real-world analytical chemistry scenarios. It discusses three different cases where statistical analysis is crucial: comparing a measured value to an accepted value, comparing results from two different measurement methods, and comparing multiple samples measured by the same method. The paragraph explains how to use t-tests to determine if there is a statistically significant difference between means and how to interpret these results in the context of experimental error. It also touches on the concept of outliers and the Grubbs test for identifying and potentially removing them from the data set.
📉 Calibration Curves and Method of Least Squares
The final paragraph discusses the use of calibration curves in chemical analyses and the method of least squares for creating these curves. It explains that this method assumes greater confidence in the X values (known quantities) than the Y values (measured quantities) and aims to minimize the vertical deviations from the line of best fit. The paragraph introduces the concept of an r-squared value, which indicates how well the data points fit the trend line. It emphasizes that while computers typically calculate the uncertainty associated with the line of best fit, a deeper understanding can be gained by studying the method in more detail.
Mindmap
Keywords
💡Gaussian Distribution
💡Mean
💡Standard Deviation
💡Degrees of Freedom
💡Variance
💡Z-Score
💡Confidence Interval
💡T-Test
💡Outliers
💡Calibration Curve
Highlights
Introduction to the use of statistics in analytical chemistry.
Assumption of prior knowledge in statistics.
Discussion on Gaussian distributions and their formation from random errors.
Explanation of the bell curve as a representation of data points clustered around the mean.
Importance of repeating experiments and using statistical analysis to estimate population parameters.
Definition and calculation of the mean (arithmetic mean or average).
Standard deviation as a measure of data clustering around the mean and its calculation.
Concept of degrees of freedom and its impact on standard deviation.
Explanation of how a larger sample size leads to a smaller standard deviation and increased confidence in the mean.
Difference between population mean (mu) and sample mean (x-bar), and population standard deviation (Sigma) and sample standard deviation (s).
Variance and its relationship with standard deviation, and the concept of relative standard deviation.
Use of standard deviation to express the uncertainty in measurements and its preference over significant figures in chemistry.
Standard deviation's relation to probability within a normal (Gaussian) distribution.
Introduction to the Z-score (z-value) and its significance in statistical analysis.
Explanation of how the uncertainty in the mean of a sample set (Sigma_sub_n) decreases with an increase in the number of samples (n).
Discussion on confidence intervals and the use of Student's T as a statistical tool to find them.
Procedure for comparing a measured result with a known value to check for agreement within experimental error.
Comparison of replicate measurements to determine if results agree within experimental error.
Use of a paired t-test for comparing individual differences between two methods of measurement.
Testing for outliers using the Grubbs test and its significance in data analysis.
Application of the method of least squares in drawing a calibration curve and its importance in chemical analyses.
Transcripts
Browse More Related Video
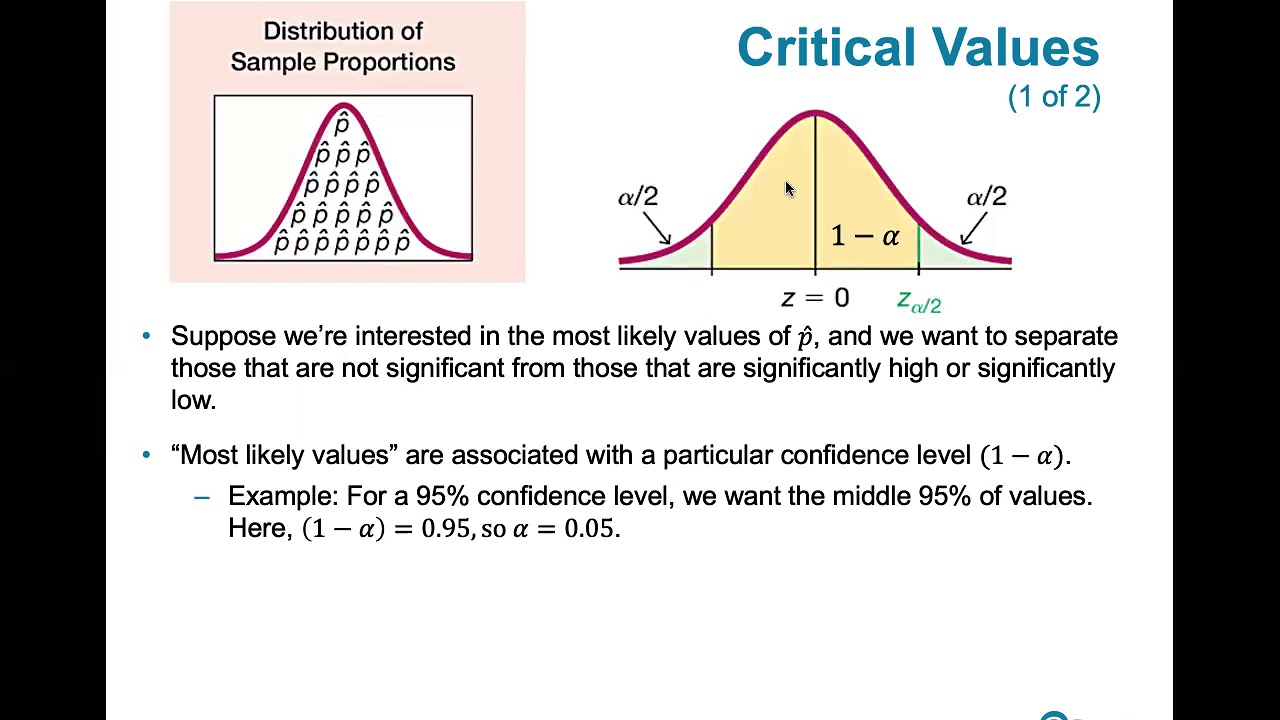
7.1.3 Estimating a Population Proportion - Critical Values, Rationale and How to Compute Them

CH403 3 Experimental Error

CH403 5 Quality Assurance and Calibration Methods

Visualizing a binomial distribution | Probability and Statistics | Khan Academy
The Normal Distribution, Clearly Explained!!!

Elementary Statistics - Chapter 6 Normal Probability Distributions Part 1
5.0 / 5 (0 votes)
Thanks for rating: