CH403 3 Experimental Error
TLDRThe transcript discusses the concept of experimental error, distinguishing between systematic and random errors. It explains how systematic errors can be identified and eliminated, while random errors are unpredictable and can only be minimized by taking multiple measurements. The difference between precision and accuracy is clarified, with precision referring to the closeness of measurements to each other and accuracy to the closeness of the average measurement to the true value. The concept of absolute and relative uncertainty is introduced, along with the propagation of uncertainty in calculations involving multiple measurements. The impact of mathematical operations on the propagation of uncertainty is discussed, with recommendations for using tools like Excel to manage complex calculations.
Takeaways
- 🔍 The concept of significant figures is used to track uncertainty in measurements, commonly taught in general chemistry.
- 📊 Experimental error can be categorized into two types: systematic error and random error. Systematic error is reproducible and consistent in its effect, while random error varies and cannot be eliminated.
- 🔄 Systematic errors can, in principle, be discovered and eliminated, whereas random errors are inherent to the measurement process and can only be minimized.
- 🌟 To minimize the impact of random error, multiple measurements or samples are taken, hoping that the errors will cancel each other out.
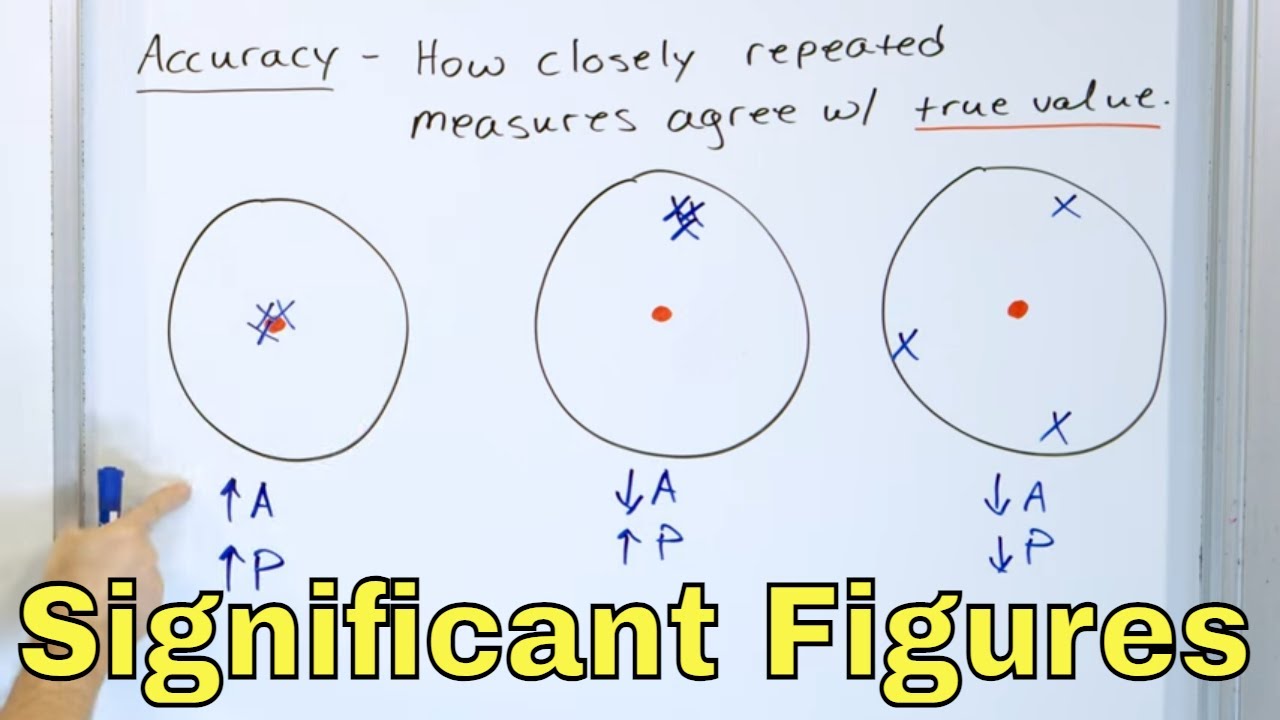
- 🎯 The difference between precision and accuracy is crucial; precision refers to the closeness of measurements to each other, while accuracy refers to how close the average of measurements is to the true value.
- 📈 Absolute uncertainty is the margin of error associated with a single measurement, whereas relative uncertainty is the ratio of absolute uncertainty to the value of the measurement.
- 🔢 Propagation of uncertainty in experiments involves mathematical operations on measurements, where the individual uncertainties do not simply add up due to the possibility of errors canceling each other out.
- 📱 For complex calculations involving uncertainty, using tools like Excel can help in breaking down the calculation into steps and managing the propagation of errors effectively.
- 🔍 When dealing with mathematical operations other than addition and subtraction, such as multiplication, division, powers, and roots, the formula for random error does not apply, and a systematic approach is needed.
- 🌐 Systematic errors add up when calculating a sum or difference, as they do not cancel each other out, leading to a compounded effect on the final measurement.
- 🧠 Understanding and applying the concepts of significant figures, experimental error, precision, accuracy, and uncertainty propagation is essential for accurate and reliable scientific measurements and results.
Q & A
What are significant figures, and why are they used?
-Significant figures are a method of expressing the precision of a measurement by indicating which digits are known with certainty plus the first digit that is uncertain. They are used as an easy way of tracking uncertainty in quantities, especially in disciplines like general chemistry, because they simplify the representation and handling of data accuracy.
What are the two types of experimental error?
-The two types of experimental error are systematic error, also known as deterministic error, and random error, or indeterminate error. Systematic error arises from flaws in experimental design or measurement execution, causing measurements to be consistently too high or too low, while random error stems from uncontrolled variables, leading to measurements that may be too high or too low by chance.
How can systematic errors be addressed in experiments?
-Systematic errors can, in principle, be discovered and eliminated through careful review and adjustment of the experimental design, measurement processes, or both. However, identifying and correcting these errors may not always be straightforward or feasible.
Why is taking multiple measurements important in reducing the impact of random error?
-Taking multiple measurements helps minimize the effect of random error on experimental results. The idea is that random errors are equally likely to make measurements too high or too low, so by taking a large number of measurements, these errors are likely to cancel each other out, leading to a more accurate average result.
What is the difference between precision and accuracy in scientific measurements?
-Precision refers to how closely multiple measurements of the same quantity are to each other, while accuracy indicates how close the average of these measurements is to the true value. A set of measurements can be precise without being accurate if they are all close together but far from the true value, and vice versa.
What is absolute uncertainty, and how does it differ from relative uncertainty?
-Absolute uncertainty is the margin of error associated with a measurement, indicating the range within which the true value is expected to lie. Relative uncertainty, on the other hand, is the ratio of absolute uncertainty to the actual measurement value, often expressed as a percentage, providing a sense of the size of the uncertainty in relation to the size of the measurement.
How is uncertainty propagated through addition or subtraction in measurements?
-When performing addition or subtraction with measurements that have uncertainty, the total uncertainty of the result is calculated by taking the square root of the sum of the squares of the individual uncertainties. This method accounts for the possibility that some errors will be positive and others negative, potentially canceling each other out.
How does the propagation of uncertainty differ for multiplication or division?
-For multiplication or division, the propagation of uncertainty is based on the percent uncertainties of the individual measurements. The percent uncertainty of the result is found by adding the squares of the percent uncertainties of the measurements and then taking the square root of that sum. This method accounts for how relative errors impact the final result.
How can the uncertainty in a result involving powers or roots be calculated?
-The percent relative uncertainty in a result involving an exponent is calculated by multiplying the exponent by the percent relative uncertainty of the base measurement. For example, if a measurement is squared, its percent relative uncertainty in the result is doubled.
Why is it recommended to use software like Excel for complex uncertainty calculations?
-Using software like Excel for complex uncertainty calculations is recommended because it can handle each step of the calculation in a separate cell, allowing for easy modification, repetition, and error tracking. This is especially useful in long calculations involving multiple types of operations (addition, subtraction, multiplication, division, etc.), where manual calculations can become cumbersome and prone to error.
Outlines
🔍 Understanding Experimental Error and Significant Figures
This paragraph introduces the concept of experimental error and significant figures, emphasizing their importance in disciplines like General Chemistry. It explains that experimental error comprises two types: systematic error, which originates from flaws in experimental design and is reproducible, and random error, which stems from uncontrolled variables and cannot be entirely eliminated. The paragraph also distinguishes between precision, which refers to the closeness of a set of measurements to each other, and accuracy, which pertains to how close the average of measurements is to the true value. It suggests that taking multiple measurements can help minimize the impact of random errors, but systematic errors persist regardless of the number of measurements taken.
📊 Propagation of Uncertainty and Calculation Methods
The second paragraph delves into the propagation of uncertainty during experiments, explaining how mathematical operations on measurements with inherent uncertainties require special handling. It clarifies that individual uncertainties cannot be simply added together due to the potential for positive and negative errors to cancel each other out. The paragraph introduces the formula for calculating the resultant uncertainty in the case of addition or subtraction, which involves taking the square root of the sum of the squares of individual uncertainties. It also addresses the more complex case of uncertainties in multiplication and division, as well as the impact of percentage uncertainties. The explanation extends to operations involving exponents, roots, and logarithms, providing formulas for calculating the relative uncertainty in these scenarios. The paragraph recommends using tools like Excel to manage and propagate errors through complex calculations.
🧬 Addressing Systematic Errors and Isotope Effects
The final paragraph discusses the treatment of systematic errors in measurements, contrasting them with random errors. It explains that while random errors might cancel out in multiple measurements, systematic errors are cumulative and do not cancel each other out. The paragraph provides an example of how the measurement of atomic mass can be affected by systematic errors due to the presence of different isotopes in a sample. It illustrates how the measurement of molecular mass for O2 carries double the uncertainty of the atomic mass of oxygen because any variation in the atomic mass of one atom will likely affect the other, thus doubling the impact on the overall measurement. This section underscores the importance of accounting for both types of errors in experimental design and data analysis to ensure accurate and reliable results.
Mindmap
Keywords
💡Significant Figures
💡Experimental Error
💡Systematic Error
💡Random Error
💡Precision
💡Accuracy
💡Absolute Uncertainty
💡Relative Uncertainty
💡Propagation of Uncertainty
💡Excel for Error Calculation
💡Systematic Errors in Summation
Highlights
Significant figures are used to track uncertainty in quantity, commonly used in general chemistry.
There are two types of experimental error: systematic error and random error.
Systematic error is reproducible and can cause measurements to be consistently too high or too low.
Random error arises from uncontrolled variables and has an equal chance of causing a measurement to be too high or too low.
Random error might be reduced by changing the experiment but cannot be eliminated.
Taking multiple measurements can help cancel out random errors.
Precision refers to how closely together a set of measurements are to each other.
Accuracy is about how close the average of measurements is to the true value.
It is possible to have precise but inaccurate measurements or accurate but imprecise measurements.
Absolute uncertainty is the margin of error associated with a measurement.
Relative uncertainty is the ratio of absolute uncertainty to the value of the measurement.
The propagation of uncertainty in an experiment involves mathematical operations on numbers, each with its own uncertainty.
Uncertainties don't simply add up because some errors may cancel each other out.
For addition or subtraction, the uncertainty is the square root of the sum of the squares of the individual uncertainties.
For multiplication or division, the percent uncertainty in the result is the sum of the percent uncertainties of the individual measurements.
Excel can be used to perform calculations involving uncertainty propagation.
Powers and roots involve different formulas for the propagation of uncertainty.
Systematic errors add up and do not cancel each other out.
The measurement of atomic mass involves both small random error and significant systematic error.
Different samples can have different ratios of isotopes, leading to varying atomic mass measurements.
Transcripts


5.0 / 5 (0 votes)
Thanks for rating: