What is Standard Deviation and Mean Absolute Deviation | Math, Statistics for data science, ML
TLDRThis video introduces the concepts of mean absolute deviation (MAD) and standard deviation, essential in statistics and data science for understanding the spread of data points around the mean. MAD is calculated by taking the mean of the absolute differences between each data point and the mean, while standard deviation involves squaring these differences, averaging them, and then taking the square root. The video uses test scores as an example to illustrate how these metrics can reveal different aspects of data distribution, with standard deviation providing a more nuanced understanding, especially in cases where MAD may not differentiate effectively between data sets with varying ranges.
Takeaways
- 📈 Mean Absolute Deviation (MAD) is a measure of variability that calculates the average distance of individual data points from the mean.
- 📊 Standard Deviation is a more advanced measure of data spread that involves squaring the differences, averaging them, and then taking the square root.
- 📚 The video uses test scores as an example to illustrate the concepts of mean absolute deviation and standard deviation.
- 🔢 MAD is calculated by taking the mean of the absolute differences between each data point and the mean of the dataset.
- 📊 Standard Deviation is calculated by taking the square root of the average of the squared differences between each data point and the mean.
- 🌟 MAD can sometimes be insufficient to represent the spread of data, especially when there are outliers.
- 📈 The video demonstrates that while MAD might give the same value for two datasets, the actual spread of data points can be different, as shown in the example with one outlier.
- 🔍 Both MAD and Standard Deviation are important in statistics and data science for understanding the distribution of data.
- 📊 The concepts of L1 and L2 norms in machine learning relate to MAD and Standard Deviation, respectively.
- 📱 The video is part of a series and the next installment will likely cover the topic of normal distribution.
- 👍 The video aims to provide a basic understanding of standard deviation and mean absolute deviation for those learning statistics or data science.
Q & A
What is the main topic of the video?
-The main topic of the video is to explain the concepts of mean absolute deviation and standard deviation in the context of data analysis.
What are the two key metrics introduced in the video for understanding data spread?
-The two key metrics introduced are Mean Absolute Deviation (MAD) and Standard Deviation (σ).
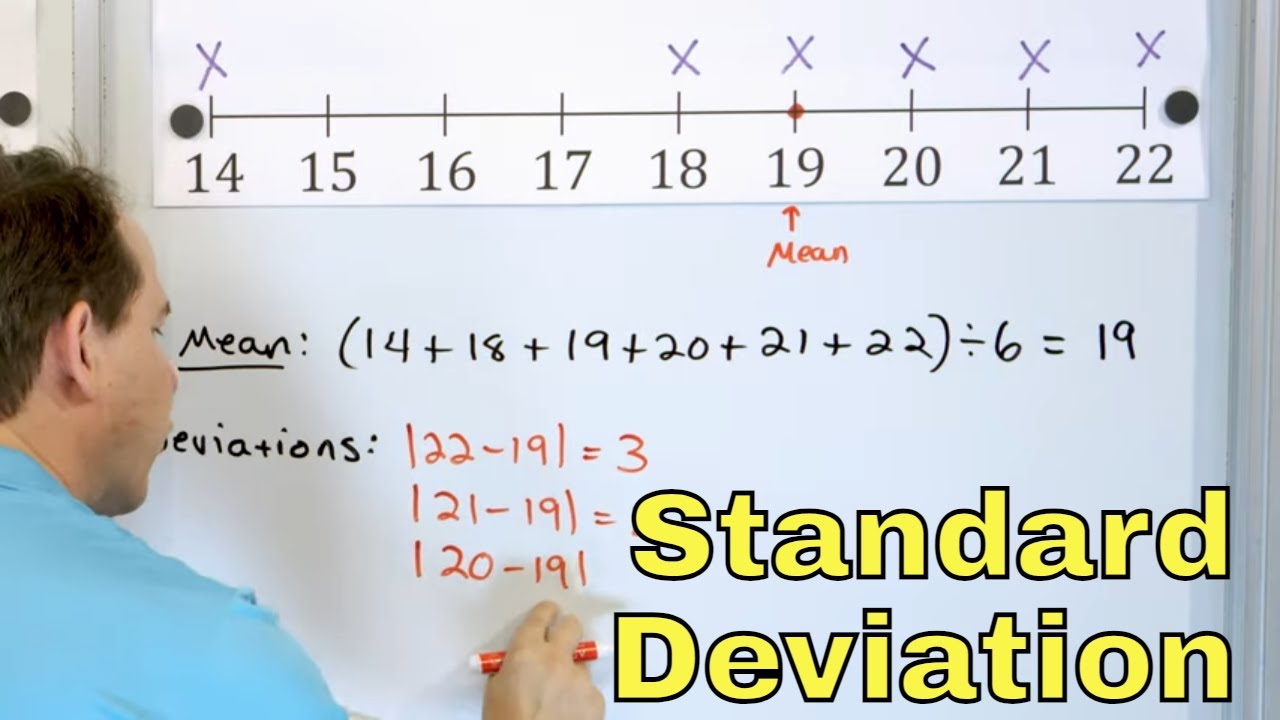
How is the average score of the history test calculated in the example?
-The average score is calculated by adding all the individual test scores and dividing by the number of scores.
What does the video illustrate about the data points in the history test versus the mathematics test?
-The video illustrates that while the average score is the same for both tests, the data points in the mathematics test are more spread out from the average compared to the history test.
What is the formula for calculating Mean Absolute Deviation (MAD)?
-MAD is calculated by taking the absolute differences between each data point and the mean, then taking the average of these differences.
Why might Mean Absolute Deviation (MAD) not be sufficient in some scenarios?
-MAD might not be sufficient when there is a significant outlier in the data set, as it does not account for the magnitude of deviation from the mean.
How is Standard Deviation (σ) calculated?
-Standard Deviation is calculated by taking the square of the differences between each data point and the mean, averaging those squares, and then taking the square root of that average.
What is the significance of the square root operation in the calculation of Standard Deviation?
-The square root operation is used to revert the data to its original scale after squaring the differences, which helps in interpreting the standard deviation in the same units as the original data.
How does the video relate the concepts of L1 and L2 norms to Mean Absolute Deviation and Standard Deviation?
-The video mentions that L1 norm refers to Mean Absolute Deviation, while L2 norm refers to Standard Deviation, which are used in machine learning techniques such as ridge regression and lasso regression.
What is the practical application of understanding Standard Deviation and Mean Absolute Deviation in data science?
-Understanding these concepts is crucial for data analysis and interpretation, as they provide insights into the spread and variability of data points, which is essential for making informed decisions and predictions in data science and statistics.
Why is it important to have a single metric to represent data spread when dealing with large data sets?
-A single metric to represent data spread is important for large data sets because it simplifies the analysis, allowing for quick and meaningful comparisons between different data sets and for identifying patterns or anomalies more efficiently.
Outlines
📊 Introduction to Absolute Deviation and Standard Deviation
This paragraph introduces the concepts of absolute deviation and standard deviation using the context of test scores. It explains how to calculate the mean absolute deviation by finding the average of the differences between individual scores and the mean score. The example given compares the spread of scores in a history test versus a mathematics test, highlighting the usefulness of these metrics in understanding data distribution. The paragraph also touches on the limitations of mean absolute deviation in certain scenarios, setting the stage for the introduction of standard deviation in the next paragraph.
📈 Calculation and Application of Standard Deviation
The second paragraph delves into the calculation and application of standard deviation as a more accurate measure of data spread. It describes the process of squaring the differences between individual data points and the mean, averaging these squares, and then taking the square root of the average. This method is compared to mean absolute deviation, showing how standard deviation can better represent the spread of data, especially when outliers are present. The paragraph also connects the concepts to machine learning terms like L1 and L2 norms, and mentions their relevance in future discussions on normal distribution.
Mindmap
Keywords
💡Mean Absolute Deviation (MAD)
💡Standard Deviation (σ)
💡Data Points
💡Average (Mean)
💡Spread
💡Histogram
💡Outliers
💡Statistics
💡Data Science
💡Machine Learning
Highlights
Mean absolute deviation and standard deviation are key concepts in statistics and data science.
Mean absolute deviation (MAD) measures how far individual data points are from the average.
Standard deviation quantifies the spread of data points with respect to the mean.
The video uses test scores as an example to illustrate the concepts of mean absolute deviation and standard deviation.
MAD is calculated by taking the mean of the absolute differences between each data point and the mean.
Standard deviation is calculated by taking the square root of the average of the squared differences between each data point and the mean.
MAD can sometimes be insufficient to accurately represent data distribution, as shown in the example with a single outlier.
The video demonstrates that while MAD shows the same value for two datasets, their data distribution can be quite different.
L1 and L2 norms in machine learning are related to mean absolute deviation and standard deviation, respectively.
Understanding standard deviation and mean absolute deviation is fundamental for anyone learning statistics or data science.
The video provides a clear and simple explanation of the concepts using a relatable example.
The process of calculating mean absolute deviation and standard deviation is broken down step by step in the video.
The video emphasizes the practical applications of these concepts in fields like data science and machine learning.
The video is designed to be a quick and informative guide to understanding mean absolute deviation and standard deviation.
The video encourages viewers to pause and think about the concepts before revealing the calculations.
The video concludes with a teaser for the next topic, which will likely be on normal distribution.
The video is part of a series that aims to provide a basic understanding of essential statistical concepts.
Transcripts
Browse More Related Video
Standard Deviation & Mean Absolute Deviation Explained - 6-8-19]

What is a "Standard Deviation?" and where does that formula come from

How to Calculate Standard Deviation
Find the Mean, Variance, & Standard Deviation of Frequency Grouped Data Table| Step-by-Step Tutorial
MEAN, VARIANCE, AND STANDARD DEVIATION FOR UNGROUPED DATA

Mean Absolute Deviation
5.0 / 5 (0 votes)
Thanks for rating: