What is a "Standard Deviation?" and where does that formula come from
TLDRThe video script offers a comprehensive explanation of standard deviation, emphasizing its significance in understanding data distribution. It guides the audience through the process of calculating the mean and standard deviation step by step, using a straightforward data set. The script clarifies that standard deviation represents the average distance from the mean, and it illustrates this concept by squaring the differences, averaging them to find variance, and finally taking the square root to obtain the standard deviation. The video aims to demystify the formula and help viewers conceptually grasp the concept, highlighting that with practice, the calculation becomes more intuitive.
Takeaways
- 📊 Understanding standard deviation is crucial for grasping data spread and variability.
- 🔢 The standard deviation quantifies the average distance of data points from the mean, reflecting the spread of the data set.
- 📌 To calculate the mean, sum all data points and divide by the number of data points (μ = Σx / N).
- 🚫 Initial attempts to find the average distance to the mean resulted in a sum of differences that always equaled zero, indicating a need for a different approach.
- 🏢 Using absolute values would eliminate negative distances but is algebraically challenging, leading to the consideration of squaring the differences instead.
- 📈 Squaring the differences (x - μ)² eliminates negative values and allows for easier algebraic manipulation.
- 🔄 The average of squared differences is known as variance, which is a related but distinct measure from standard deviation.
- 🌱 Taking the square root of the variance yields the standard deviation, effectively returning to the concept of average distance from the mean.
- 📝 The standard deviation formula for a population is the square root of the average squared distance from the mean (SD = √[Σ(x - μ)² / N])
- 🔎 Practical demonstration of calculating standard deviation by hand was provided using a sample data set (3, 4, 5, 6, 7).
- 📊 The process of calculating standard deviation can be verified using statistical functions on calculators or software.
Q & A
What is the main concept discussed in the transcript?
-The main concept discussed in the transcript is understanding standard deviation, which is a measure of the spread or dispersion of a set of data points.
How is the standard deviation related to the mean of a data set?
-The standard deviation is related to the mean as it measures the average distance of each data point from the mean. It gives an idea of how spread out the data is around the central value, which is the mean.
What is the first step in calculating the standard deviation?
-The first step in calculating the standard deviation is to find the mean (average) of the data set.
What does the term 'Sigma' represent in the context of the standard deviation calculation?
-In the context of standard deviation calculation, 'Sigma' (Σ) represents the summation symbol used in mathematics to denote the addition of a series of terms. It is used to add up all the individual data points in the set.
Why is squaring the differences between data points and the mean used in the standard deviation calculation?
-Squaring the differences between data points and the mean is used to eliminate negative values and ensure that all the distances are positive. This makes the values algebraically easier to manipulate and allows for a meaningful average distance from the mean.
What is the term used for the average squared distance from the mean?
-The average squared distance from the mean is referred to as the variance.
How do you convert the variance back to the standard deviation?
-To convert the variance back to the standard deviation, you take the square root of the variance. This operation returns the measure to the original unit of measurement and gives the average distance from the mean.
What is the significance of the standard deviation in data analysis?
-The standard deviation is significant in data analysis as it provides a measure of the spread or variability of the data. It helps in understanding the data distribution and gives insights into the data's behavior and patterns.
How does the process of calculating standard deviation help in understanding complex mathematical formulas?
-The process of calculating standard deviation helps in understanding complex mathematical formulas by breaking down the steps and providing a conceptual grasp of what the formula is calculating. It demystifies the formula by explaining the logic and purpose behind each step.
What is the practical application of knowing the standard deviation in a data set?
-Knowing the standard deviation in a data set allows you to make inferences about the data's variability and the potential for outliers. It can be used in various fields such as finance, research, and quality control to assess risk, make predictions, and improve processes.
How does the transcript suggest learning complex mathematical concepts like standard deviation?
-The transcript suggests that learning complex mathematical concepts like standard deviation involves a process of repeated exposure and practice. It likens the learning process to seeing the concept multiple times, where initially it may seem confusing, but with patience and persistence, it becomes clearer and easier to understand.
Outlines
📘 Introduction to Standard Deviation
The speaker begins by emphasizing the importance of understanding standard deviation as a measure of how spread out data is, which is a fundamental concept in the course. The aim is to demystify the concept and the complex formula associated with it, making it accessible and understandable. Through an iterative learning approach, the speaker promises to clarify the concept by breaking it down into simple steps, starting with basic definitions and gradually moving towards explaining the formula itself. The narrative is set to patiently guide the viewer from initial confusion to clarity, using a simple data set to explain the concept of mean and the process of calculating the average distance to the mean, laying the groundwork for understanding standard deviation.
📐 Breaking Down the Calculation
In this section, the speaker continues the explanation by detailing the calculation process of the mean and average distance to the mean, using a simple data set as an example. The significance of the sigma symbol in representing summation is discussed, illustrating the mathematical shorthand that makes complex calculations more manageable. The speaker then introduces the concept of variance by explaining the limitations of using absolute values for calculating the average distance to the mean and proposes squaring each deviation from the mean as a solution. This approach leads to the introduction of variance as the average squared distance from the mean, setting the stage for understanding the standard deviation formula.
🔍 From Variance to Standard Deviation
This paragraph delves into the transition from calculating variance to understanding standard deviation. The speaker outlines the process of squaring the differences between each data point and the mean to avoid negatives, thus calculating the variance. However, to revert from squared units back to the original units, taking the square root of the variance is proposed, which effectively introduces the concept of standard deviation as the square root of the average squared distances from the mean. This section aims to solidify the viewer's understanding of standard deviation, emphasizing its role in measuring how spread out the data is around the mean.
📊 Applying Standard Deviation
In the concluding section, the speaker applies the standard deviation formula to a new data set, demonstrating the calculation step by step and reinforcing the learning objectives. By calculating the mean and then using the formula to find the standard deviation, the speaker illustrates the practical application of these concepts. This hands-on example serves to demystify the formula and show its utility in understanding data spread. The speaker encourages the viewer to conceptualize standard deviation not just as a mathematical abstraction but as a meaningful measure of how much data varies around the mean, thereby tying together the theoretical aspects with practical application.
Mindmap
Keywords
💡Standard Deviation
💡Mean
💡Spread
💡Variance
💡Absolute Value
💡Squaring
💡Square Root
💡Data Points
💡Calculation
💡Conceptual Understanding
💡Algebraic Manipulation
Highlights
Understanding standard deviations is a crucial concept in the course, providing insight into how data is spread out.
The process of learning about standard deviations can initially seem confusing, but with repetition and patience, it becomes more comprehensible.
The mean (average) of a dataset is calculated by adding all the values and dividing by the number of values.
The average distance to the mean is found by calculating the individual distances from the mean, summing them up, and dividing by the number of values.
Standard deviation is related to the average distance from the mean, but it involves squaring the differences to eliminate negative values.
The variance is introduced as the average squared distance from the mean, which is a precursor to calculating the standard deviation.
To find the standard deviation, one must take the square root of the variance, which is the square root of the average squared distance from the mean.
The use of the squaring function ensures that all differences are positive, facilitating algebraic manipulation and statistical analysis.
The standard deviation is a measure that helps in understanding the spread or dispersion of a dataset.
The concept of standard deviation is foundational and can be applied to various problems and real-world scenarios.
The process of calculating standard deviation involves multiple steps, including finding the mean, calculating individual distances, squaring those distances, finding the average of those squared distances, and finally taking the square root.
The transcript provides a detailed walkthrough of the standard deviation calculation, making it accessible for learners at different levels.
The use of absolute values was considered but deemed less practical for further algebraic manipulation, leading to the adoption of squaring as a method to handle negative differences.
The transcript emphasizes the importance of understanding the 'crazy formula' behind standard deviation and encourages learners to persevere through the initial confusion.
The concept of standard deviation is explained using a step-by-step approach, starting with a simple dataset and gradually building up to a more complex example.
The transcript provides a practical example of calculating standard deviation by hand, which helps in solidifying the understanding of the concept.
The transcript concludes with a reminder of the standard deviation's significance as the average distance from the mean, reinforcing the core idea behind the calculation.
Transcripts
Browse More Related Video
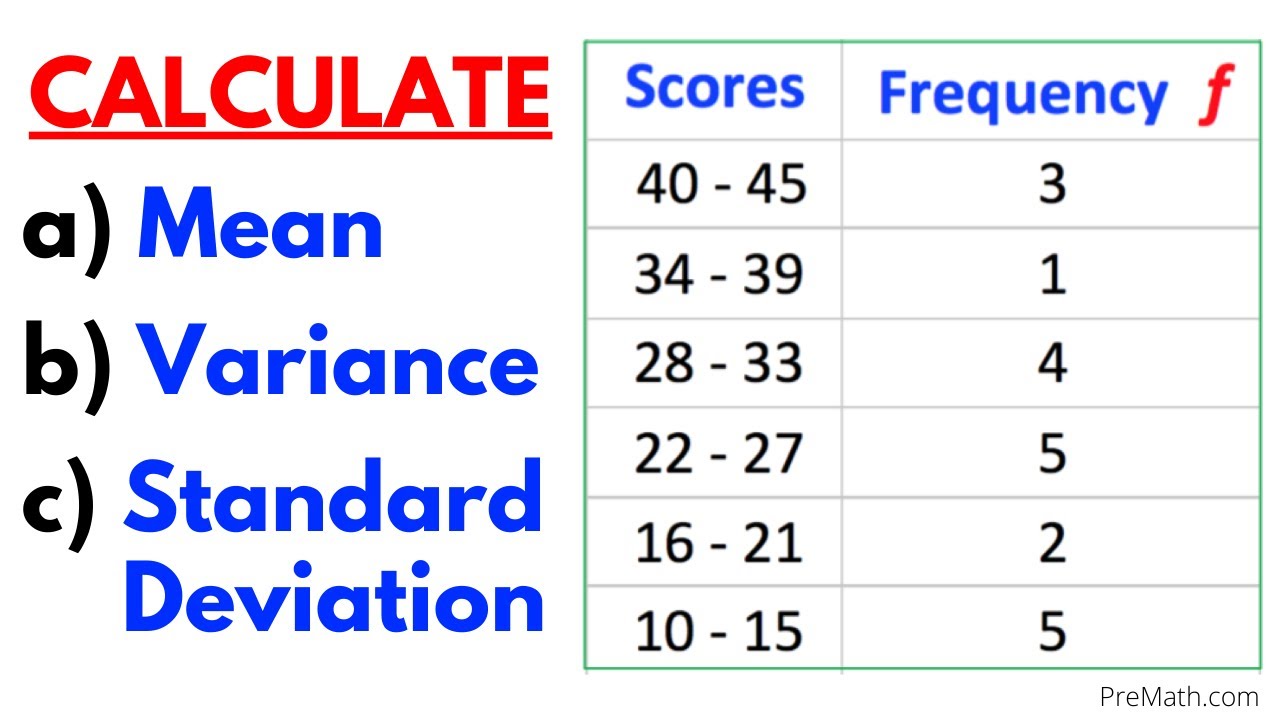
Find the Mean, Variance, & Standard Deviation of Frequency Grouped Data Table| Step-by-Step Tutorial
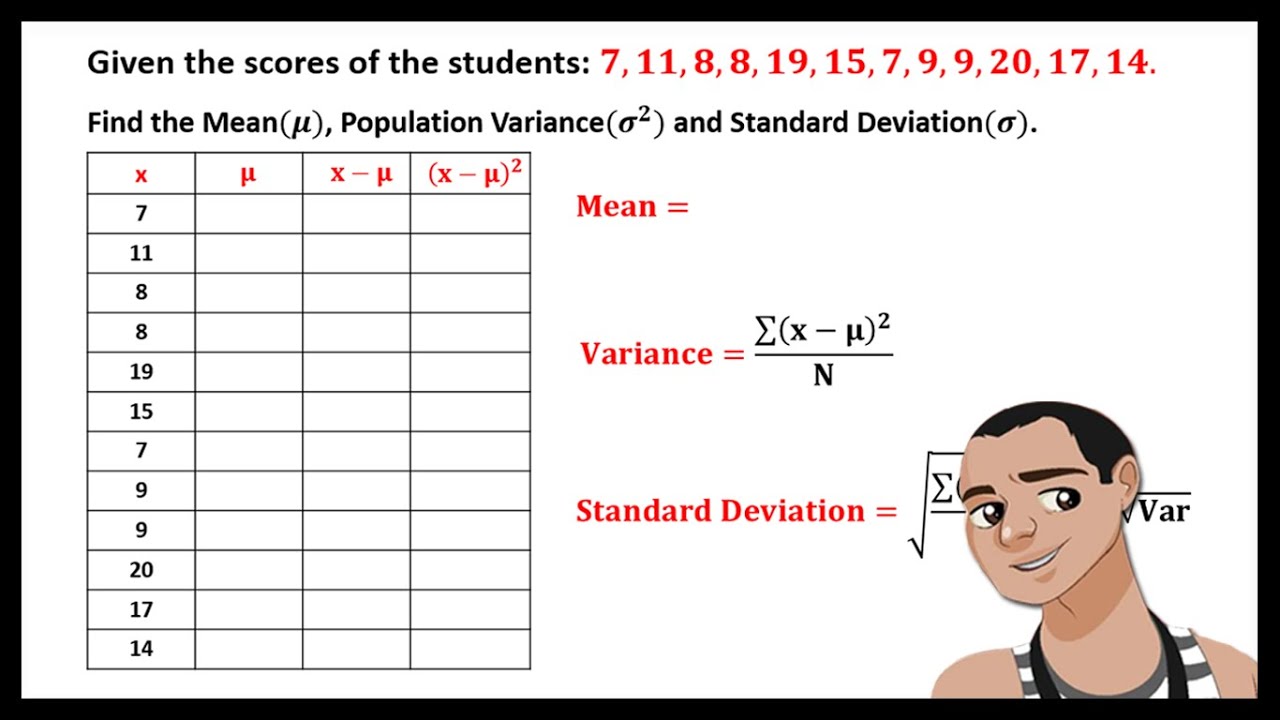
MEAN, VARIANCE, AND STANDARD DEVIATION FOR UNGROUPED DATA

What is Standard Deviation and Mean Absolute Deviation | Math, Statistics for data science, ML
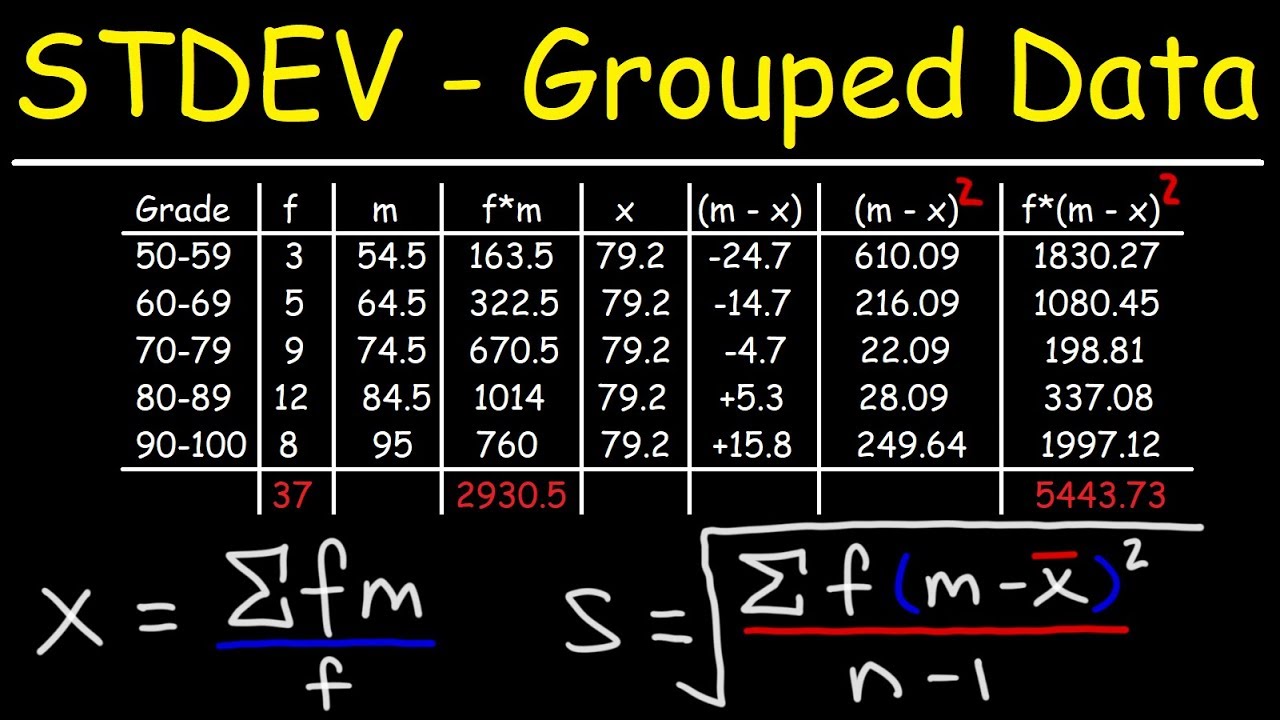
How To Calculate The Standard Deviation of Grouped Data

Standard Deviation and Variance
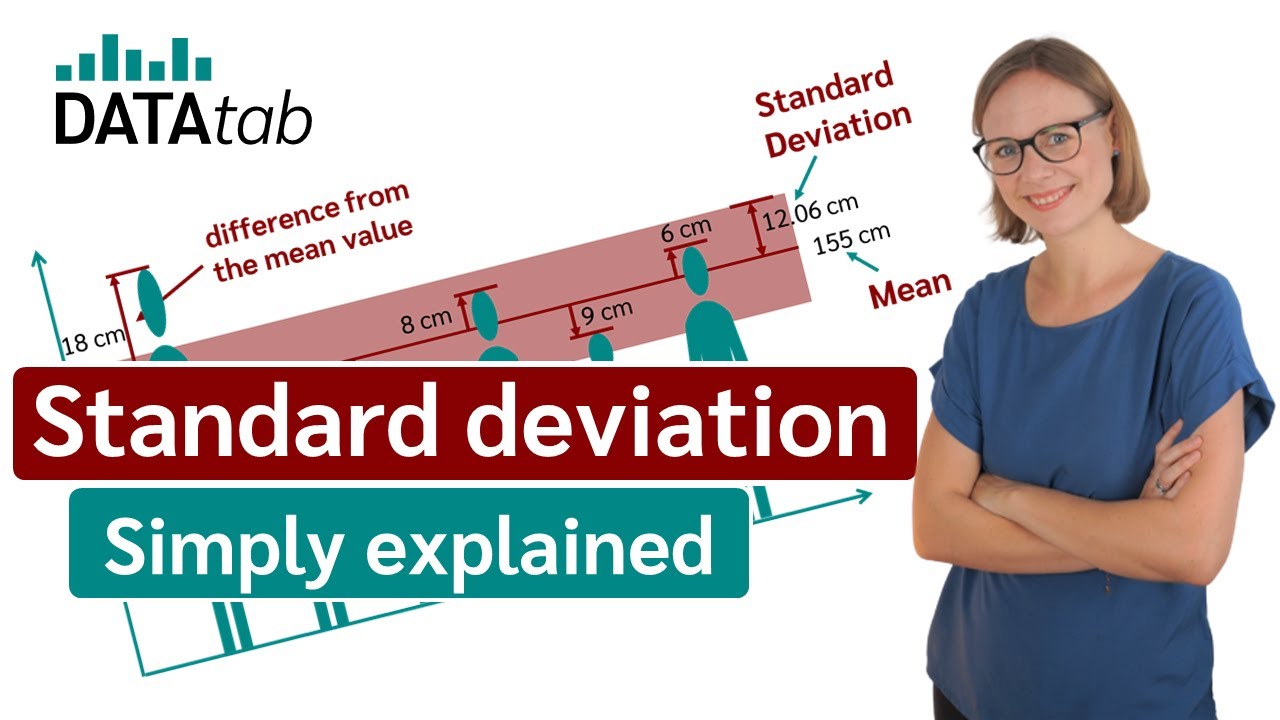
Standard deviation (simply explained)
5.0 / 5 (0 votes)
Thanks for rating: