Simple explanation of Modified Z Score | Modified Z Score to detect outliers with python code
TLDRThe video script presents a comprehensive explanation of modified z-score and its application in outlier detection within datasets. It begins with a simple example of human height data to illustrate the concepts of mean, median, and standard deviation. The script then delves into the calculation of z-score and modified z-score, emphasizing their use in identifying outliers. An Excel demonstration and a Python code example are provided to show how these concepts can be applied in practice, using height data and movie revenue data. The video concludes by highlighting that the choice between using z-score and modified z-score depends on the specific dataset and the presence of outliers.
Takeaways
- 📊 The script introduces the concepts of modified z-score and its use in detecting outliers in data science.
- 👶 The explanation aims to be simple enough for a child to understand, using relatable examples like people's height.
- 📈 The script compares the effectiveness of mean and median in handling data with outliers, showing that median is less affected by extreme values.
- 🧮 The median absolute deviation (MAD) is introduced as a measure similar to standard deviation but based on the median instead of the mean.
- 🎯 The modified z-score formula is provided, which involves subtracting the median from the data point, dividing by MAD, and multiplying by 0.6745.
- 🔍 An Excel demonstration is given to show how to calculate z-scores and modified z-scores, and how to identify outliers using these methods.
- 🎬 The script uses a dataset of movie revenues to illustrate the application of z-scores and modified z-scores in practice.
- 🏆 The example shows that while the z-score might miss some outliers, the modified z-score can detect more due to its resistance to extreme values.
- 🤔 The decision to treat high values as outliers or normal is subjective and depends on the context of the data analysis.
- 🔗 The video description provides a link to the code used in the analysis, allowing viewers to replicate the process.
- 👍 The script concludes with a recommendation to experiment with both z-score and modified z-score to determine which is more suitable for a given dataset.
Q & A
What is the main topic of the video?
-The main topic of the video is to explain the concept of modified z-score and its use in detecting outliers in data science, using both an Excel demonstration and Python code.
How is the mean height calculated for the group of people in the study?
-The mean height is calculated by taking the sum of all the heights and dividing it by the number of people in the group.
What is the difference between mean and median in the context of the data set provided?
-The mean is the average height calculated by summing all heights and dividing by the number of people, while the median is the middle value when all heights are sorted in ascending order.
Why is the median a better indicator than the mean when there are outliers in the data set?
-The median is less affected by outliers because it is the middle value and does not consider the magnitude of extreme values, making it a more reliable measure of central tendency in the presence of outliers.
What is the formula for calculating the Median Absolute Deviation (MAD)?
-The formula for MAD is to take each data point, subtract the median of the entire series, take the absolute value, and then find the median of those absolute values.
How is the modified z-score calculated for a single data point?
-The modified z-score for a single data point is calculated as (x - median of x) / MAD * 0.6745, where x is the data point and MAD is the Median Absolute Deviation.
What is the usual threshold for considering a data point an outlier using the modified z-score?
-The usual threshold for considering a data point an outlier using the modified z-score is 3.5 or more.
How does the video demonstrate the difference in outlier detection between z-score and modified z-score?
-The video demonstrates this by using a height data set where the z-score method fails to detect an obvious outlier (a height of 10 feet), while the modified z-score method successfully identifies it as an outlier.
What is the dataset used for the Python code example in the video?
-The dataset used for the Python code example is a trimmed down version of a movies dataset from Kaggle, which includes information such as movie names and their revenues.
How does the video address the issue of outliers affecting the mean and standard deviation?
-The video explains that when outliers are present, they can skew the mean and standard deviation, making it difficult for the regular z-score method to accurately detect outliers. It suggests using the modified z-score as an alternative approach in such cases.
What is the conclusion of the video regarding the use of z-score and modified z-score for outlier detection?
-The conclusion is that there is no one-size-fits-all approach to outlier detection. Depending on the data distribution and the presence of outliers, either z-score or modified z-score can be more effective. It is recommended to try both methods and make a decision based on the specific situation.
Outlines
📊 Introduction to Modified Z-Score and Outlier Detection
The video begins with an introduction to modified z-score and its application in detecting outliers within datasets. The presenter explains the concepts of mean and median, and how they are used in the context of outlier detection. An example using people's heights is provided to illustrate the impact of outliers on mean and median. The video then transitions into discussing standard deviation and normal distribution, leading to the explanation of z-score. The presenter emphasizes the subjectivity of outliers and the importance of context in deciding whether to treat high values as outliers or not. The segment ends with a practical demonstration of how outliers can skew mean and standard deviation, and introduces the concept of median absolute deviation (MAD) as a more robust measure against the influence of outliers.
📈 Excel Demonstration of Z-Score and Modified Z-Score
This paragraph presents an Excel demonstration on calculating z-scores to detect outliers. The presenter guides the audience through the process of finding the average height and standard deviation, and then computing the z-score for each individual height. The limitations of z-score in detecting outliers when the mean is significantly affected by high values are highlighted. The video then introduces the modified z-score, which uses median and MAD instead of mean and standard deviation, and shows how it can more effectively identify outliers. The Excel demonstration includes step-by-step instructions on calculating MAD and applying the modified z-score formula, and concludes with an example of how a height of 10 feet is correctly identified as an outlier using the modified z-score.
🎬 Python Code for Outlier Detection in Movie Revenue Data
The presenter moves on to using Python for outlier detection in a dataset of movie revenues. After loading and examining a trimmed CSV file from Kaggle, the presenter demonstrates how to convert revenue figures into millions of dollars for easier analysis. The video then shows how to calculate z-scores using Python's pandas library, and how these z-scores can be used to identify outliers. The presenter also explains the potential limitations of z-scores when dealing with skewed data or small sample sizes. The paragraph concludes with the introduction of modified z-score in Python, detailing the process of calculating MAD and using it to compute modified z-scores, which can more accurately detect outliers in the presence of extreme values.
🔍 Comparing Z-Score and Modified Z-Score for Outlier Detection
In this section, the presenter compares the effectiveness of z-score and modified z-score in detecting outliers within the movie revenue dataset. The comparison reveals that while z-score identified only one outlier (Avatar), the modified z-score was able to detect additional outliers (Jurassic World and The Bodyguard). The presenter emphasizes that there is no one-size-fits-all approach to outlier detection and that the choice between z-score and modified z-score should be based on the specific characteristics of the dataset and the goals of the analysis. The video ends with a recommendation to experiment with both methods to determine which is more suitable for a given situation, especially when dealing with small datasets or significant outliers that can skew the mean.
🙌 Conclusion and Call to Action
The video concludes with a summary of the analysis conducted on movie revenues using both z-score and modified z-score for outlier detection. The presenter provides a link to the code used in the video in the video description and encourages viewers to try out the methods themselves. The presenter also asks viewers to like and share the video if they found it helpful, and thanks them for watching, ending the session on a positive note.
Mindmap
Keywords
💡Outliers
💡Mean
💡Median
💡Standard Deviation
💡Z-Score
💡Median Absolute Deviation (MAD)
💡Modified Z-Score
💡Excel Demo
💡Python Code
💡Data Analysis
💡Outlier Detection
Highlights
The presentation explains the concept of modified z-score and its application in detecting outliers in data science in a simplified manner.
An Excel demonstration is provided to illustrate the calculation of mean, median, and standard deviation.
The importance of understanding standard deviation and normal distribution is emphasized for grasping the z-score concept.
A practical example of analyzing people's height data is used to demonstrate the calculation of mean and median.
The impact of outliers on the mean is discussed, showing how it can skew the data representation.
The median absolute deviation (MAD) is introduced as a method less affected by outliers compared to standard deviation.
The mathematical formula for MAD is explained, involving the median of absolute deviations from the median.
A modified z-score is defined and its calculation formula is provided for detecting outliers more effectively.
An Excel demonstration shows how to calculate the modified z-score for a given data set.
The video presents a case study of property price analysis where the modified z-score successfully identifies an outlier.
A comparison is made between regular z-score and modified z-score for outlier detection in a movie revenue dataset.
Python code is provided to load and process a movie dataset from Kaggle for outlier detection using z-scores.
The video demonstrates how to convert large revenue figures into a more manageable format by representing them in millions.
A function is written in Python to calculate the z-score for each data point in the movie revenue dataset.
The concept of modified z-score is applied to the movie dataset, revealing additional outliers not detected by the regular z-score.
The video concludes with guidance on choosing between regular z-score and modified z-score based on the data distribution and presence of outliers.
A link to the code used in the video is promised in the video description for further exploration by the viewers.
The presenter encourages viewers to experiment with the provided methods and decide on their own criteria for treating outliers.
Transcripts
Browse More Related Video
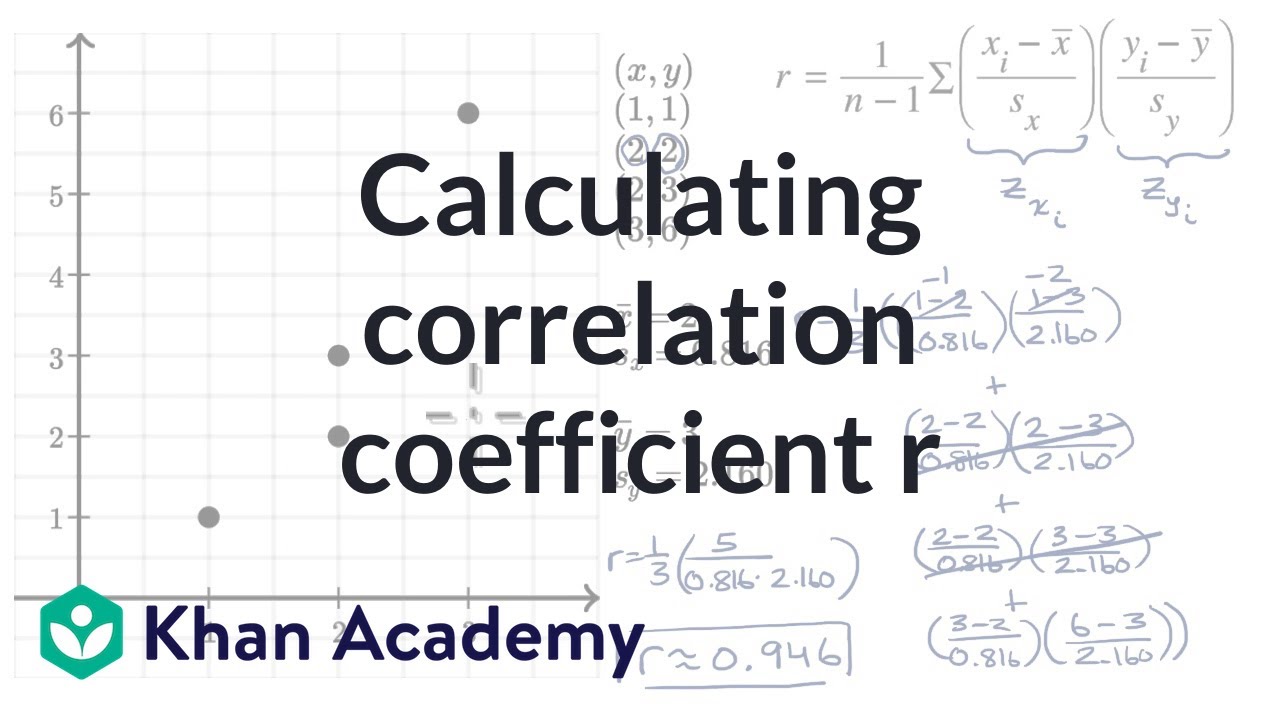
Calculating correlation coefficient r | AP Statistics | Khan Academy

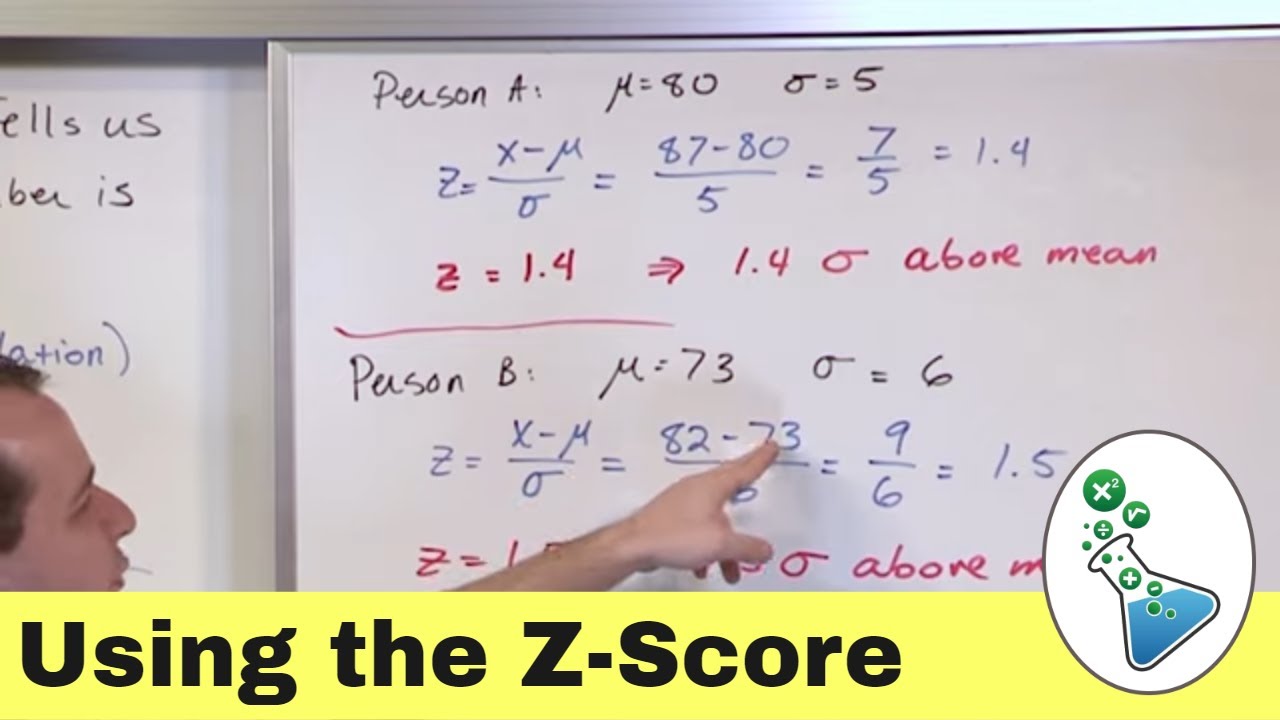
Statistics 101: Understanding Z-scores
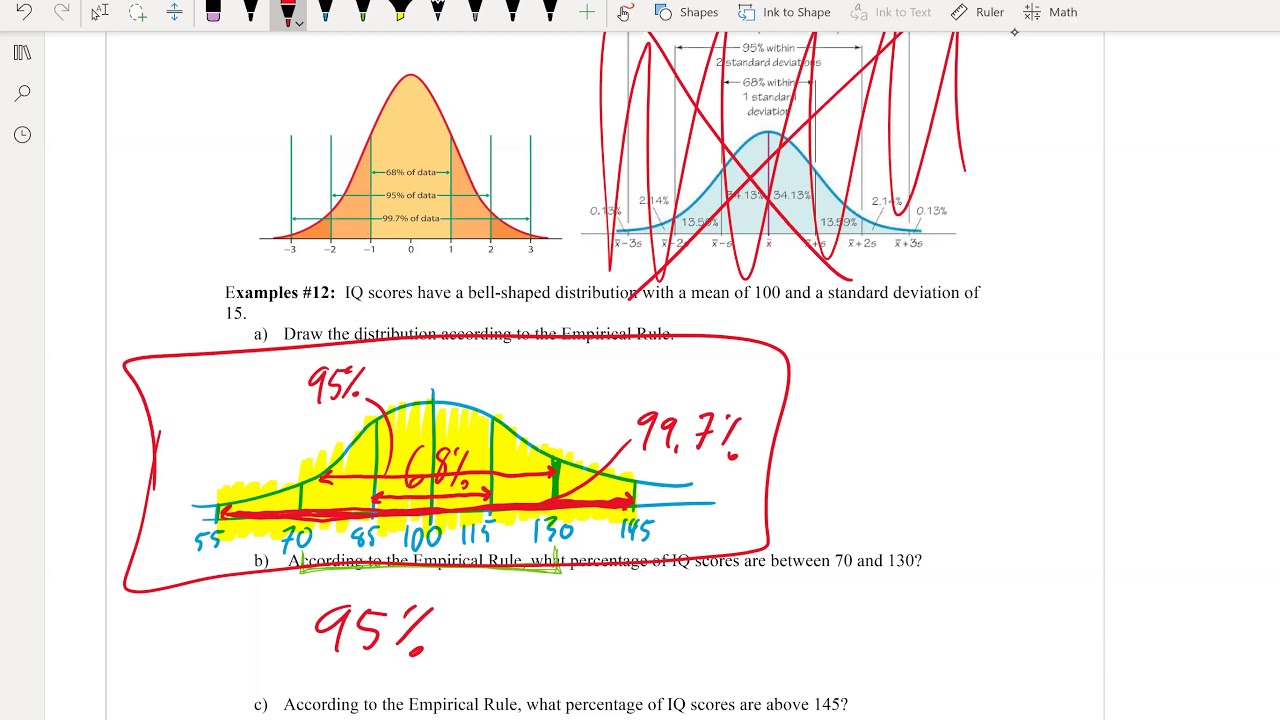
Intro to Standard Z-Score & Normal Distribution in Statistics
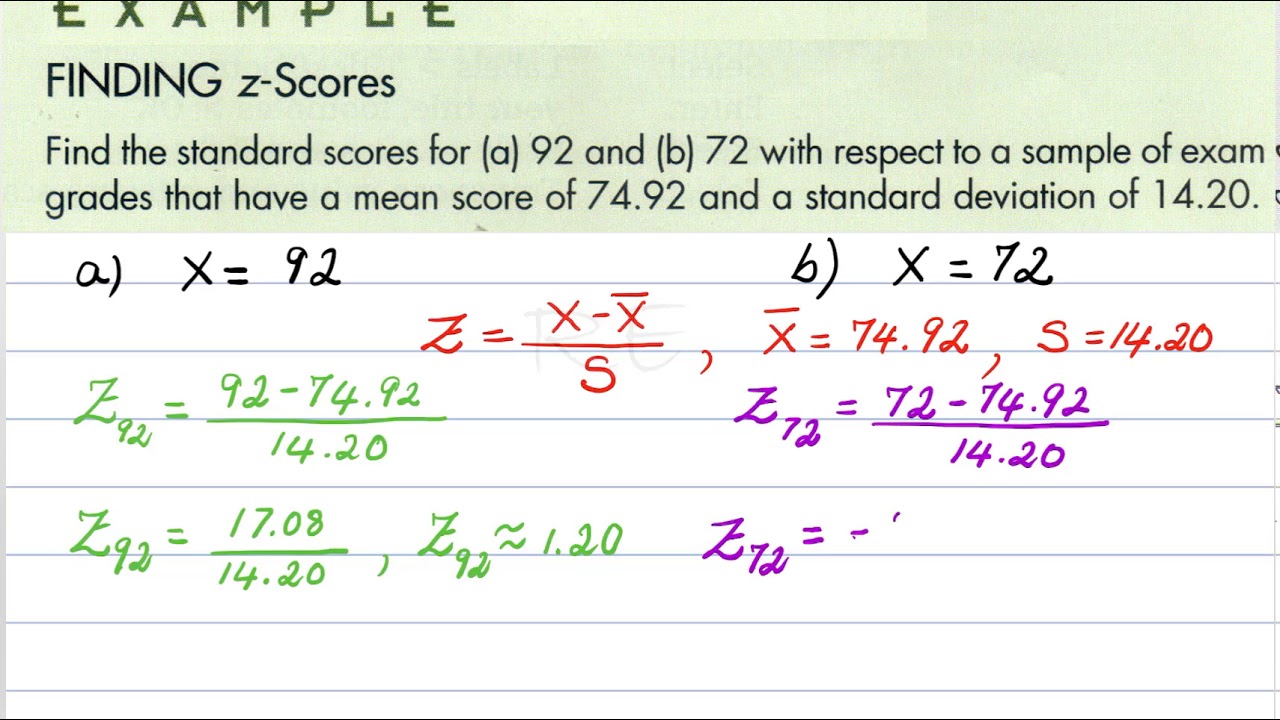
Math 119 Chapter 3 part 3
Math 20 Lesson 3.5 Descriptive Measures for Populations, Z score Video 3
Math 14 HW 6.4.6-T Using the Central Limit Theorem
5.0 / 5 (0 votes)
Thanks for rating: