Calculating correlation coefficient r | AP Statistics | Khan Academy
TLDRThe video script presents a detailed walkthrough of calculating the correlation coefficient for a set of bi-variate data by hand. It begins by explaining the sample mean and standard deviation for X and Y data points, then transitions into the calculation of the correlation coefficient using Z scores. The process involves finding the Z score for each corresponding X and Y, multiplying these, and averaging the products. The result, R, indicates the strength and direction of the linear relationship between the variables. The script concludes with an intuitive explanation of how Z scores contribute to the correlation, emphasizing that R values close to 1 or -1 indicate a strong positive or negative linear relationship, respectively.
Takeaways
- 📊 The video explains how to calculate the correlation coefficient manually for a set of bi-variate data, where each X data point has a corresponding Y data point.
- 🔢 The sample mean and standard deviation for both X and Y data sets are calculated before determining the correlation coefficient.
- 🌟 The formula for the correlation coefficient involves finding the Z scores (standardized values) for each X and Y data point and then taking the product of these Z scores.
- 📐 The Z score is calculated by finding the difference between each data point and its mean, divided by the sample standard deviation.
- 🔍 The process involves simplifying the calculations by recognizing that pairs of data points with the same Z scores (e.g., both zero) will not contribute to the final sum.
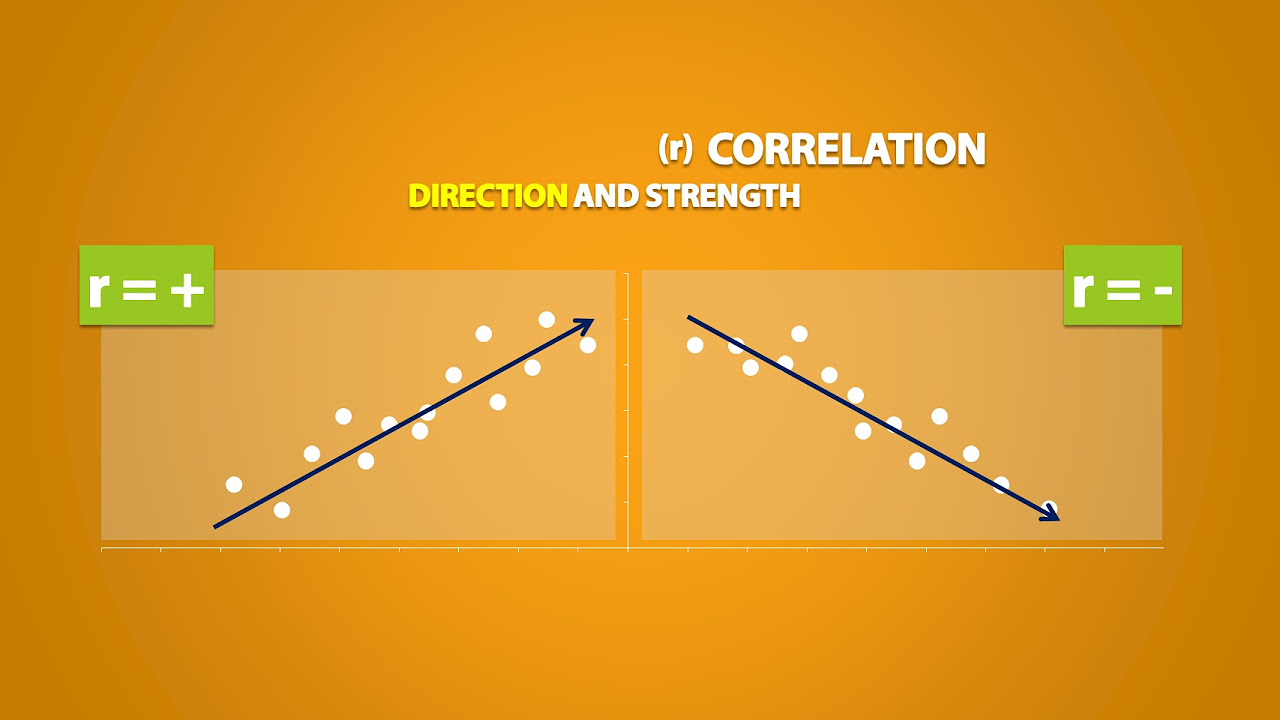
- 📈 The correlation coefficient (R) ranges from -1 to 1, with 1 indicating a perfect positive linear relationship, -1 indicating a perfect negative linear relationship, and 0 indicating no linear relationship.
- 🤔 The video emphasizes the value of calculating the correlation coefficient by hand to gain an intuitive understanding of the data relationship, despite the practicality of using software tools.
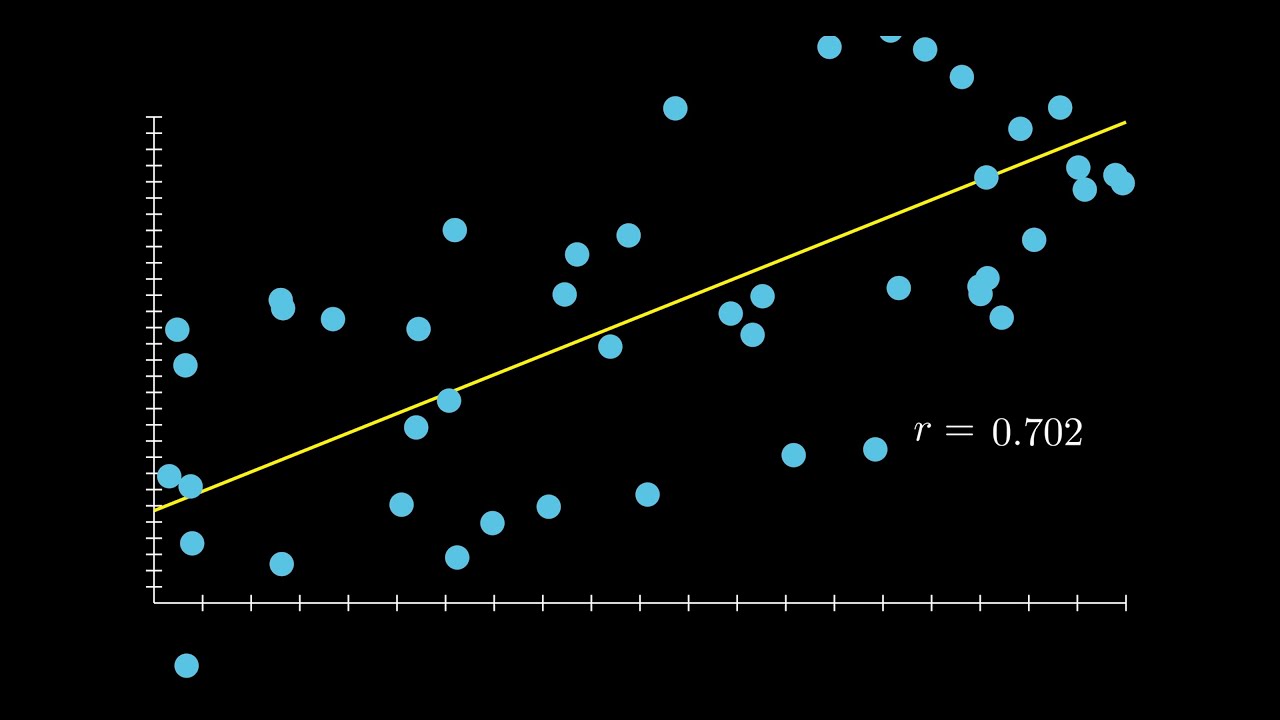
- 🎯 The final calculated R value in the example is approximately 0.946, indicating a strong positive correlation between the X and Y data points.
- 📊 The least squares line, which is used to describe the relationship between X and Y, will always pass through the mean of X and Y data points.
- 🤔 The video also discusses the intuition behind Z scores and how their products in the correlation coefficient calculation reflect the strength and direction of the relationship between variables.
Q & A
What is the main topic of the video?
-The main topic of the video is to demonstrate how to calculate the correlation coefficient for a set of bi-variate data by hand.
What does 'bi-variate' mean in the context of this video?
-In the context of this video, 'bi-variate' refers to data that has two variables for each data point, with each X data point having a corresponding Y data point.
How is the sample mean for X calculated in the video?
-The sample mean for X is calculated by adding up all the X values (1, 2, 2, 3) and dividing by the number of data points, which is (1+2+2+3)/4 = 8/4 = 2.
What is the formula for calculating the sample standard deviation?
-The sample standard deviation is calculated as the square root of the sum of the squared differences between each data point and the sample mean, divided by the number of data points minus one.
What is the sample standard deviation for X in the video?
-The sample standard deviation for X is approximately 0.816, calculated from the differences between each X value and the sample mean of 2.
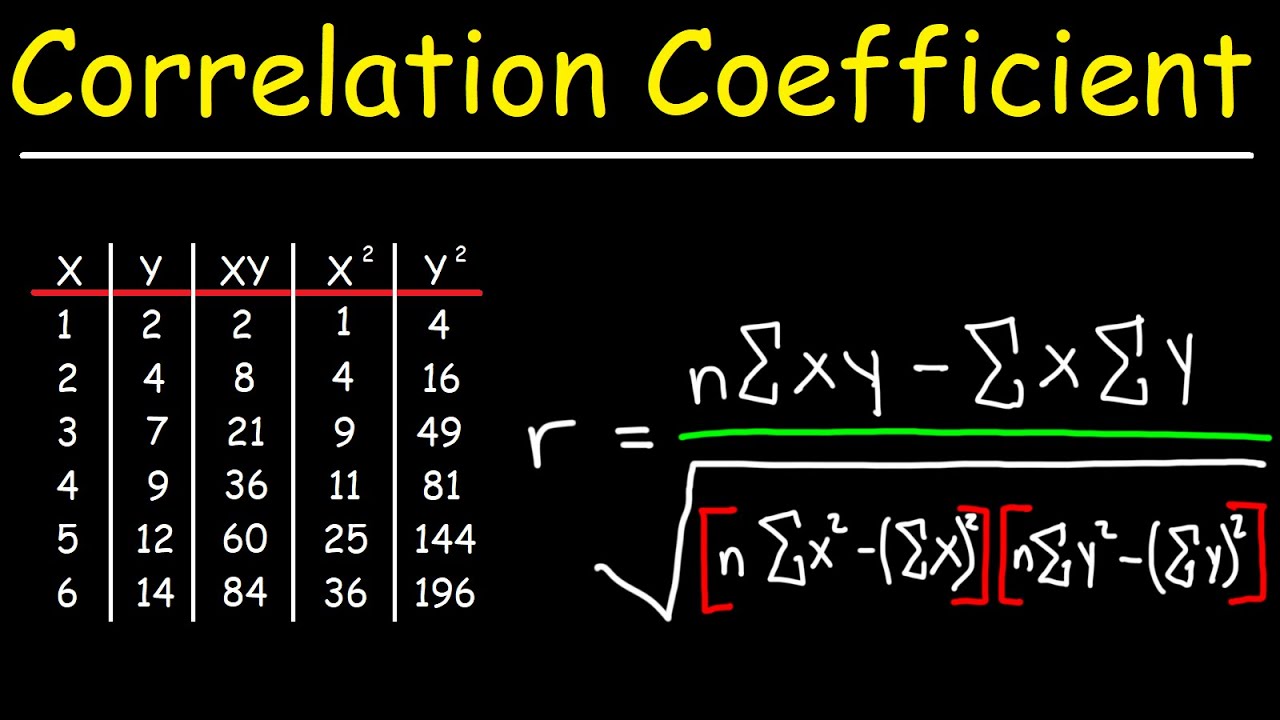
How is the correlation coefficient (R) calculated?
-The correlation coefficient (R) is calculated by taking the sum of the products of the Z scores of corresponding X and Y data points, divided by the number of pairs minus one (N-1).
What is the value of R calculated in the video?
-The value of R calculated in the video is approximately 0.946, indicating a strong positive correlation between the X and Y data points.
What does a correlation coefficient of 1 indicate?
-A correlation coefficient of 1 indicates a perfect positive linear relationship between two variables, meaning that as one variable increases, the other also increases in a consistent manner.
What does a correlation coefficient of -1 indicate?
-A correlation coefficient of -1 indicates a perfect negative linear relationship between two variables, meaning that as one variable increases, the other decreases in a consistent manner.
What does the Z score represent?
-The Z score represents the number of standard deviations a data point is away from the mean of its distribution. It is used to standardize the data and make it easier to compare across different scales.
Why is it valuable to calculate the correlation coefficient by hand?
-Calculating the correlation coefficient by hand is valuable because it provides an intuitive understanding of the relationship between the variables and the process involved in determining the strength and direction of their correlation.
How does the Z score contribute to the calculation of the correlation coefficient?
-The Z score contributes to the calculation of the correlation coefficient by standardizing the data points, allowing for the comparison of the direction and magnitude of their relationship relative to their respective means and standard deviations.
Outlines
📊 Introduction to Calculating Correlation Coefficient
This paragraph introduces the concept of calculating the correlation coefficient manually for a set of bi-variate data. It explains that bi-variate data consists of pairs of X and Y data points, and emphasizes the importance of understanding other related statistics such as sample mean and standard deviation for both X and Y before proceeding with the calculation. The paragraph also provides a brief overview of how to calculate these statistics and sets the stage for the detailed explanation of the correlation coefficient calculation that follows in the subsequent paragraphs.
🧮 Calculation of the Correlation Coefficient
In this paragraph, the instructor delves into the specifics of calculating the correlation coefficient. It begins by simplifying the formula for the correlation coefficient and explaining the concept of Z scores. The paragraph walks through the calculation process step by step, showing how to find the Z scores for each X and Y data point and then use these to compute the correlation coefficient. The example given uses four pairs of data points and results in an R value of approximately 0.946, indicating a strong positive correlation between X and Y. The paragraph also discusses the significance of the R value and what it implies about the relationship between the two variables.
📈 Interpreting the Results and Understanding Z Scores
The final paragraph focuses on interpreting the calculated correlation coefficient and understanding the role of Z scores in the calculation. It explains how the R value reflects the strength and direction of the relationship between X and Y, with a value of 1 indicating a perfect positive correlation and -1 indicating a perfect negative correlation. The paragraph also revisits the concept of Z scores, using a visual approach to demonstrate how data points that are both above or below the mean in the same direction contribute positively to the correlation coefficient, while points in opposite directions (one above and one below the mean) detract from it. This visual explanation helps to solidify the intuition behind the numbers and the meaning of the correlation coefficient.
Mindmap
Keywords
💡Bi-variate data
💡Sample mean
💡Sample standard deviation
💡Correlation coefficient
💡Z score
💡Standard deviations away
💡N minus one
💡Sum of products
💡Positive correlation
💡Negative correlation
Highlights
The video demonstrates how to calculate the correlation coefficient by hand for a set of bi-variate data.
Bi-variate data refers to data where each X data point has a corresponding Y data point.
The sample mean for X is calculated as the sum of X values divided by the number of data points.
The sample standard deviation for X is the square root of the sum of the squared differences from the mean, divided by one less than the number of data points.
The sample mean for Y is calculated in a similar manner to X, by summing all Y values and dividing by the number of data points.
The sample standard deviation for Y follows the same calculation method as for X, resulting in a value of 2.160.
The correlation coefficient calculation involves finding the Z scores for each corresponding X and Y pair.
Z scores represent how many standard deviations a data point is away from the mean.
The formula for the correlation coefficient involves summing the products of the Z scores and dividing by one less than the number of pairs.
The calculation results in an R value of approximately 0.946, indicating a strong positive correlation between X and Y.
A correlation coefficient of positive one indicates a perfect positive linear relationship between two variables.
A correlation coefficient of negative one indicates a perfect negative linear relationship between two variables.
A correlation coefficient of zero suggests no linear relationship between the variables.
The video emphasizes the value of performing the calculation by hand to gain an intuitive understanding of the correlation coefficient.
The process of calculating the correlation coefficient is typically done using software or computer tools due to its complexity.
The least squares line, which is used to describe the relationship between X and Y, will always pass through the mean of X and Y.
The video visually illustrates the calculation process and the concept of Z scores with a手绘图.
The explanation of how Z scores contribute to the correlation coefficient provides insight into the meaning of positive and negative correlations.
Transcripts
Browse More Related Video
Correlation Coefficient
Correlation and Coefficient of Determination in 3 Minutes
Explanatory and Response Variables, Correlation (2.1)

Linear Regression and Correlation - Introduction
Calculating the equation of a regression line | AP Statistics | Khan Academy
Correlation and Regression Analysis: Learn Everything With Examples
5.0 / 5 (0 votes)
Thanks for rating: