Statistics 101: Understanding Z-scores
TLDRThis video tutorial introduces the concept of z-scores in basic statistics, focusing on their calculation and interpretation. The instructor uses a classroom exam scores example to illustrate how a z-score measures the distance of a data point from the mean in terms of standard deviations. The video clarifies that z-scores are unitless, emphasizing their role in comparing data variability and their importance in advanced statistical analysis.
Takeaways
- 📚 The video is aimed at individuals new to statistics, such as introductory students or those needing a refresher on basic concepts.
- 📈 The focus of the video is on measures of variability, specifically introducing the concept of z-scores to the audience.
- 📊 The video uses a classroom example with exam scores to illustrate the difference between two classes having the same mean but different variances.
- 📉 A line graph is presented to visually demonstrate the spread of scores for each class, highlighting the concept of variability.
- 🔍 Z-scores are defined as a measure of the distance a data point is from the mean, in terms of the number of standard deviations.
- 📏 The standard deviation acts as a 'ruler' in measuring the distance of data points from the mean, emphasizing the standardized unit of measurement.
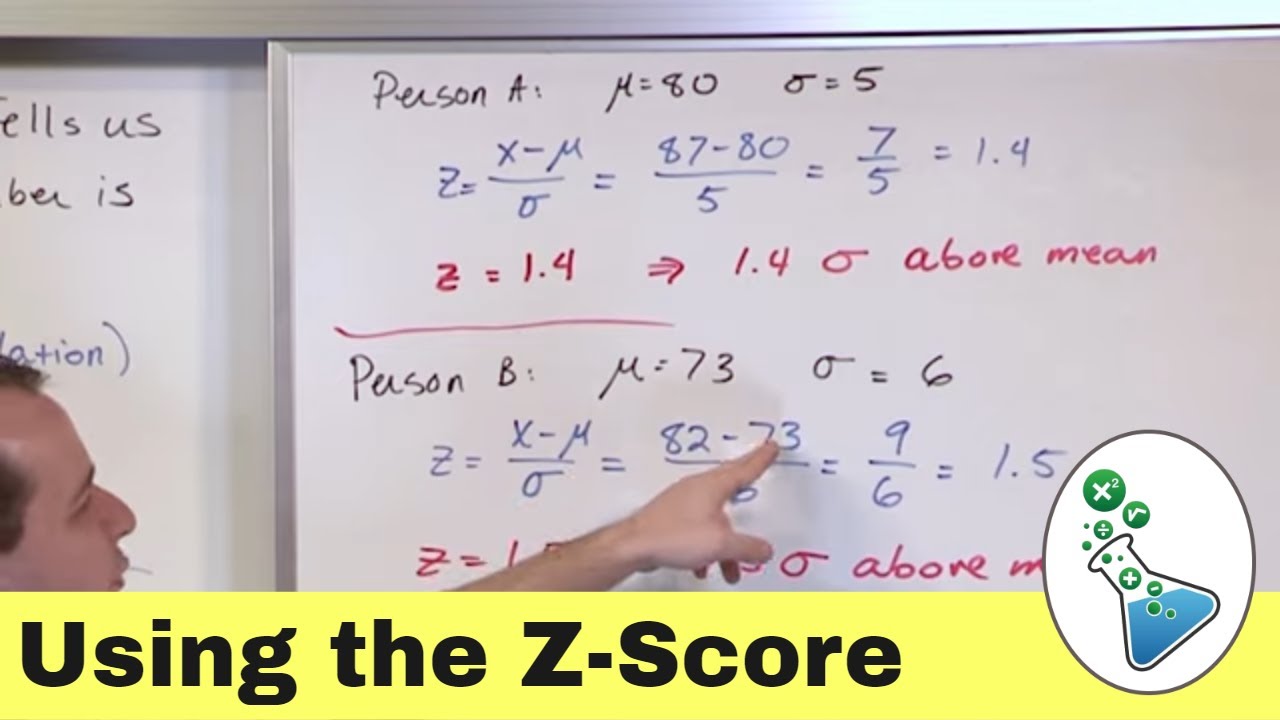
- 🔢 Z-scores are calculated by subtracting the mean from a data point and dividing by the standard deviation, providing a unitless measure of dispersion.
- 📝 The formula for calculating z-scores is presented, emphasizing its simplicity and the process of finding the difference between each data point and the mean.
- 📉 A visual representation of z-scores is given, showing how data points can be placed on a number line relative to their z-scores.
- 🏈 The video also references an analysis of NFL field goals, using z-scores to compare the variability in the line of scrimmage for the longest kicks in different seasons.
- 🔑 Z-scores are highlighted as essential tools in statistics for comparing different samples or populations, indicating their importance in more advanced statistical analysis.
Q & A
What is the main topic of the video?
-The main topic of the video is the concept of z-scores in the context of basic statistics, particularly how they relate to measures of variability and standard deviation.
Who is the target audience for this video?
-The target audience for this video includes individuals who are new to statistics, such as students in an introductory stats course or people who need to refresh their understanding of basic statistical concepts.
What is the purpose of discussing z-scores in the video?
-The purpose of discussing z-scores is to explain how they can be used to measure the distance of a data point from the mean in terms of standard deviations, and to clarify why they are often misunderstood in introductory statistics classes.
How does the video illustrate the difference in variability between two classes with the same mean score?
-The video uses a line graph to show that even though both classes have the same mean score of 85, class one has a wider distribution of scores, indicating greater variability, compared to class two where the scores are closer to the mean.
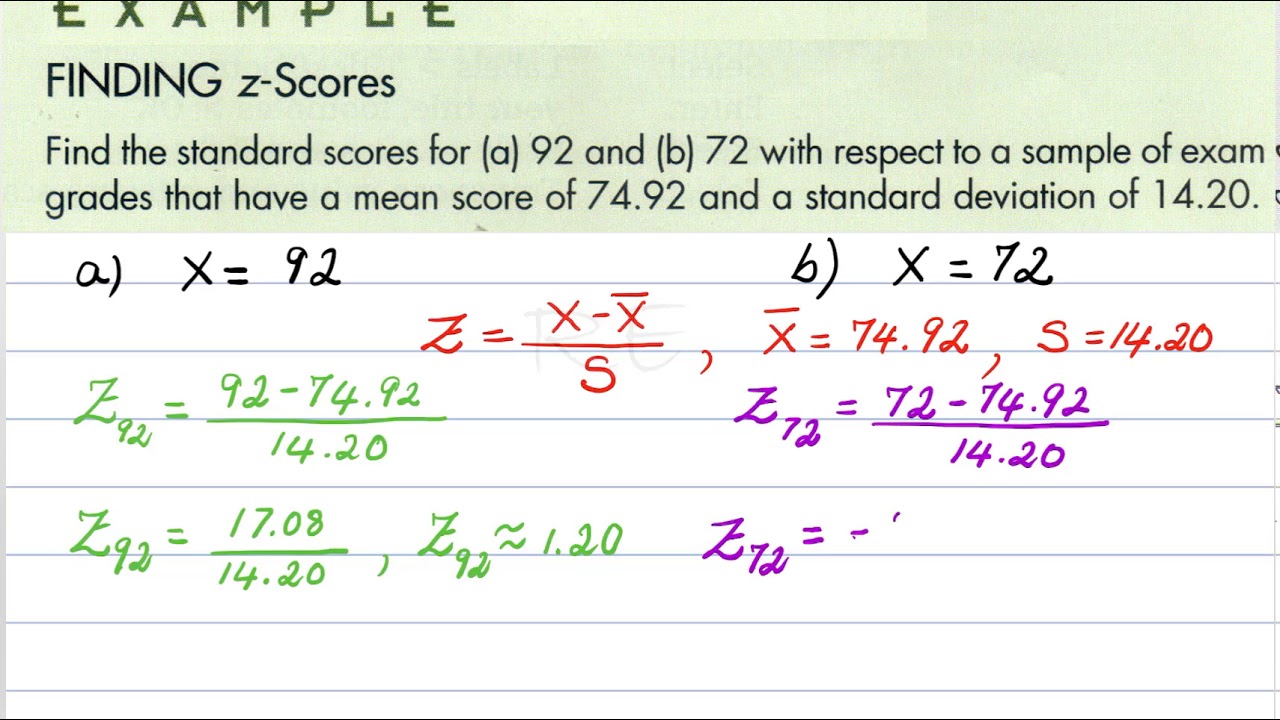
What is the formula for calculating a z-score?
-The formula for calculating a z-score is (data point - mean) / standard deviation. This formula measures how many standard deviations a particular data point is from the mean.
Why are z-scores considered a standardized measure?
-Z-scores are considered a standardized measure because they use the standard deviation as a unit of measurement, allowing for a consistent way to compare how far data points are from the mean across different datasets.
How does the video use the analogy of a ruler to explain standard deviation and z-scores?
-The video compares the standard deviation to a ruler, where the standard deviation becomes the measuring unit, and z-scores indicate how many 'ruler units' a data point is from the mean.
What is the significance of the z-score being zero for the mean in the data?
-The z-score is zero for the mean because the mean is defined as being zero distance from itself, making it a reference point from which deviations are measured.
Can you provide an example of how z-scores are calculated for a set of exam scores?
-Sure, for a set of exam scores with a mean of 85 and a standard deviation of 7.9, a score of 95 would have a z-score of (95 - 85) / 7.9, which equals 1.27, indicating it is 1.27 standard deviations above the mean.
How does the video use the example of NFL field goals to demonstrate the application of z-scores?
-The video uses the example of NFL field goals to show how z-scores can be used to analyze and compare the variability in the line of scrimmage for the longest field goals across different seasons.
What is the coefficient of variation mentioned in the video, and how is it related to z-scores?
-The coefficient of variation is the standard deviation divided by the mean, expressed as a percentage. It is related to z-scores in that it provides a measure of relative variability, which is similar to the concept of standardizing the distance from the mean that z-scores represent.
Outlines
📚 Introduction to Z-Scores and Variability
This paragraph introduces the concept of z-scores within the context of basic statistics, particularly for newcomers to the field such as introductory stats students or those looking to refresh their knowledge. The speaker uses an example of two classes with the same mean exam score but different distributions to illustrate the concept of variability. The standard deviation is introduced as a measure of this variability, and the idea of z-scores as a way to express how far a data point is from the mean in terms of standard deviations is explained. The paragraph sets the stage for a deeper dive into z-scores and their calculation.
📉 Understanding Z-Scores and the Standard Deviation
The speaker elaborates on the concept of z-scores, emphasizing their role as a measure of distance from the mean in standard deviation units. The paragraph explains that z-scores are unitless and purely a measure of dispersion. The standard deviation is likened to a ruler, with z-scores indicating how many 'ruler units' a data point is from the mean. The formula for calculating z-scores is introduced, and a simple example is provided to demonstrate the calculation process, using a dataset with a mean and standard deviation to compute z-scores for individual data points.
📈 Visualizing Z-Scores with a Line Graph
The explanation shifts to visualizing z-scores using a line graph, where the mean is centered, and standard deviations are marked as intervals from the mean. The speaker shows how to plot data points on this graph according to their z-scores, providing a visual representation of the data's dispersion. This visual aid helps to understand the relationship between z-scores and the concept of a normal distribution, where most data points fall within one or two standard deviations from the mean.
🏈 Applying Z-Scores to NFL Field Goal Data
The speaker applies the concept of z-scores to real-world data, specifically the starting positions of the longest field goals in NFL seasons from 2010 and 2011. The mean and standard deviation of the line of scrimmage for these field goals are calculated, and the data is visualized on a football field diagram. The z-scores are used to analyze the distribution of these starting positions, showing that most of them fall within a range of -3 to +3 standard deviations from the mean.
🔚 Conclusion on the Importance of Z-Scores
In conclusion, the speaker reiterates the simplicity and importance of z-scores in statistics. Z-scores are summarized as a measure of how far a data point is from the mean in terms of standard deviations, and their utility in comparing different datasets is highlighted. The speaker emphasizes that z-scores are a fundamental tool in statistical analysis, which will be further explored in future videos.
Mindmap
Keywords
💡Basic Statistics
💡Measures of Variability
💡Z-scores
💡Mean
💡Standard Deviation
💡Data Point
💡Distribution
💡Line Graph
💡Coefficient of Variation
💡NFL Field Goals
Highlights
Introduction to basic statistics concepts, tailored for beginners.
Explanation of measures of variability, focusing on the concept of z-scores.
Clarification of the confusion around z-scores in introductory statistics classes.
Use of a line graph to illustrate the difference in variance between two classes with the same mean.
Introduction of the z-score as a measure of distance from the mean in terms of standard deviations.
Analogies used to explain the concept of standard deviation as a measuring unit.
Description of z-scores as standardized measures ignoring actual measurement units.
Presentation of a simple formula to calculate z-scores.
Illustration of z-score calculation with an example using exam scores.
Visual representation of z-scores on a line graph with standard deviations marked.
Application of z-scores to analyze NFL field goal data from the 2010 and 2011 seasons.
Explanation of the coefficient of variation and its calculation.
Graphical tool used for visualizing football field data and its analysis.
Discussion on the practical use of z-scores in comparing different samples or populations.
Emphasis on the simplicity of calculating z-scores and their importance in advanced statistics.
Conclusion summarizing the key points about z-scores and their utility in statistics.
Transcripts
Browse More Related Video
Intro to Standard Z-Score & Normal Distribution in Statistics
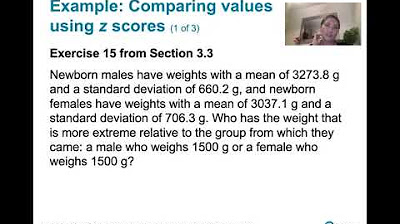
3.3.1 Measures of Relative Standing and Boxplots - Computing and Interpretting z Scores
Math 20 Lesson 3.5 Descriptive Measures for Populations, Z score Video 3
ck12.org normal distribution problems: z-score | Probability and Statistics | Khan Academy

Elementary Stats Lesson #4

Z-Scores, Standardization, and the Standard Normal Distribution (5.3)
5.0 / 5 (0 votes)
Thanks for rating: