Math 119 Chapter 3 part 3
TLDRThis educational video script covers key statistical concepts, including identifying unusual data values using standard deviation, calculating minimum and maximum usual values, and applying the empirical rule to bell-shaped data distributions. It introduces the z-score for comparing data across different sets and explains percentiles, quartiles, and their role in creating box plots. The script also demonstrates how to construct and modify box plots to identify outliers, providing step-by-step instructions and examples to enhance understanding.
Takeaways
- 📚 The video concludes the discussion of Chapter 3, focusing on statistical concepts such as unusual values, the empirical rule, z-scores, percentiles, and box plots.
- 📉 Unusual values can be identified using the rule of thumb where data points beyond two standard deviations from the mean are considered unusual.
- 📊 The empirical rule is applicable to bell-shaped and symmetric data distributions, stating that approximately 68%, 95%, and 99.7% of observations fall within one, two, and three standard deviations of the mean, respectively.
- 🧐 Z-scores are a standardized measure indicating how many standard deviations an element is from the mean, which is crucial for comparing data across different sets or within the same set.
- 🔢 Percentiles divide data into 100 equal parts, with each part representing 1% of the data set, and are used to understand the relative standing of data points.
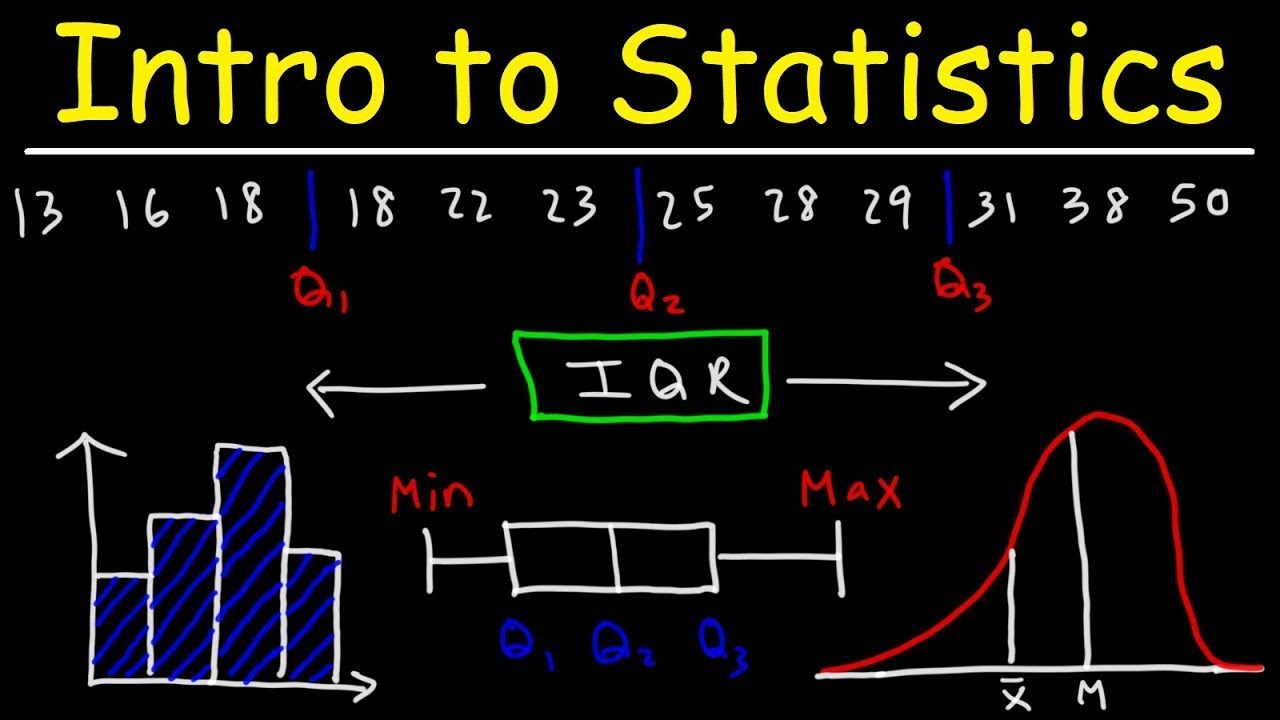
- 📈 Quartiles are special types of percentiles that split the data into quarters, with the first quartile (Q1) at the 25th percentile, the second quartile (Q2) or median at the 50th percentile, and the third quartile (Q3) at the 75th percentile.
- 📊 The Interquartile Range (IQR) is a measure of statistical dispersion, calculated as the difference between Q3 and Q1, indicating the spread of the middle 50% of the data.
- 📘 Box plots are graphical representations of data that include the median, quartiles, and potential outliers, providing a quick summary of key data features.
- 🚫 Outliers are data points that fall outside the range of Q1 - 1.5*IQR and Q3 + 1.5*IQR and can be identified and represented differently in a modified box plot.
- 🛠 The video demonstrates how to calculate and interpret various statistical measures using examples, emphasizing practical application over theoretical explanation.
- ✍️ The importance of understanding statistical tools like box plots and z-scores is highlighted for analyzing and interpreting data in various contexts.
Q & A
What is the rule of thumb used to determine unusual data values when the standard deviation is known?
-The rule of thumb states that an unusual value is any data value that falls below the mean minus two standard deviations or above the mean plus two standard deviations. In formula terms, the minimum usual value equals the mean minus two times the standard deviation, and the maximum usual value equals the mean plus two times the standard deviation.
Can you provide an example of how to determine unusual pulse rates based on the given data?
-Sure. Given the mean pulse rate of 76 beats per minute and a standard deviation of 12.5, the minimum and maximum usual pulse rates can be calculated as 51 and 101, respectively (76 - 2*12.5 and 76 + 2*12.5). A pulse rate of 110 would be considered unusual as it exceeds the maximum usual value of 101.
What is the empirical rule, and how does it apply to data interpretation?
-The empirical rule is a guideline for interpreting data values in a bell-shaped and symmetric distribution. It states that approximately 68% of the observations fall within one standard deviation of the mean, 95% within two standard deviations, and about 99.7% within three standard deviations of the mean.
How can the empirical rule be used to determine the percentage of IQ scores between 70 and 130?
-According to the empirical rule, 95% of the data falls within two standard deviations of the mean. Since IQ scores have a mean of 100 and a standard deviation of 15, the range from 70 to 130 falls within two standard deviations (85 to 115). Therefore, 95% of IQ scores are expected to be between 70 and 130.
What is the z-score, and how is it used to compare data across different sets or within the same set?
-A z-score is a measure of how many standard deviations an observation is from the mean. It standardizes values so they can be compared across different data sets or within the same set. A z-score is calculated as (x - mean) / standard deviation for a sample, or (x - population mean) / population standard deviation for an entire population.
How would you calculate the z-scores for women and men who are six feet tall?
-For a woman who is six feet (72 inches) tall, the z-score is calculated as (72 - 64) / 2.7, which is approximately 2.963. For a man, it's calculated as (72 - 69.3) / 2.8, which is approximately 0.964. These scores indicate how many standard deviations the height is from the mean height for each gender.
What is a percentile, and how is it used to measure the relative standing of a data point within a data set?
-A percentile is a measure that indicates the value below which a given percentage of observations in a group of observations fall. It divides the data set into 100 equal parts, each representing 1% of the data. The percentile of a data point x is found by taking the number of values less than x, dividing by the total number of values, and multiplying by 100.
How do you find the data value corresponding to a specific percentile, such as the 10th percentile?
-To find the data value corresponding to a specific percentile, you calculate 'L' using the formula L = k/100 * n, where 'k' is the percentile and 'n' is the total number of data values. You then round L to the nearest whole number, which represents the position of the data value in the ordered list. The data value at this position is the value at the specified percentile.
What is the interquartile range (IQR), and how is it calculated?
-The interquartile range (IQR) is a measure of statistical dispersion and is found by subtracting the first quartile (Q1) from the third quartile (Q3). It represents the range within which the central 50% of the data lies, indicating the spread of the middle half of the data set.
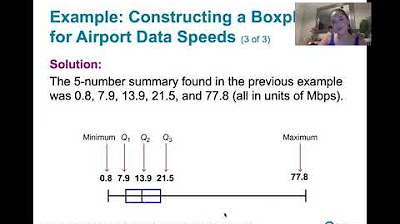
How do you construct a box plot, and what does it represent?
-A box plot is constructed using the five number summary: minimum, first quartile (Q1), median (Q2), third quartile (Q3), and maximum. It consists of a box bounded by Q1 and Q3, with a line inside representing the median. Whiskers extend from the box to the minimum and maximum, excluding outliers. A box plot provides a visual representation of the distribution of data, showing the spread and skewness of the data set.
How are outliers identified and represented in a box plot?
-Outliers are identified by calculating the lower and upper fences using the formulas Q1 - 1.5*IQR and Q3 + 1.5*IQR, respectively. Observations below the lower fence or above the upper fence are considered outliers. In a box plot, outliers are represented by open circles or stars, and the whiskers extend to the nearest non-outlier data points.
Outlines
📚 Introduction to Unusual Data Values
The video begins by discussing how to identify unusual data values when the standard deviation is known. It introduces a rule of thumb stating that data within two standard deviations from the mean is considered usual, while data outside this range is unusual. An example is provided using pulse rates from a national health survey, with a mean of 76 beats per minute and a standard deviation of 12.5, to determine if a pulse rate of 110 is unusual. The calculation shows that the usual range is between 51 and 101 beats per minute, thus classifying 110 as unusual.
📉 Understanding the Empirical Rule
The script then delves into the empirical rule, which is applicable for bell-shaped and symmetric data distributions. It explains that approximately 68% of observations fall within one standard deviation of the mean, 95% within two standard deviations, and 99.7% within three standard deviations. The empirical rule is illustrated using IQ scores with a mean of 100 and a standard deviation of 15, showing how to determine the percentage of scores within certain ranges and the small percentage of scores that fall outside the range of three standard deviations.
📊 Exploring Z-Scores and Their Significance
The video introduces z-scores as a measure of relative standing within a data set, indicating how many standard deviations an observation is from the mean. It explains that z-scores allow for comparison of data across different sets or within the same set. The formula for calculating z-scores is presented, and an example is given to calculate the z-scores for women and men who are six feet tall, using height data for women aged 20 to 29 with a mean of 64 inches and a standard deviation of 2.7 inches, and for men with a mean of 69.3 inches and a standard deviation of 2.8 inches.
🔢 Calculating Percentiles and Their Applications
The script discusses percentiles as measures of location that divide a data set into 100 equal groups. It explains how to find the percentile of a data value and provides an example using weight gain during pregnancy. The process involves counting the number of values less than a given value and dividing by the total number of values to find the percentile. The example calculates the 40th percentile for a weight gain of 37 pounds, demonstrating the calculation and its interpretation.
📈 Determining Quartiles and the Interquartile Range (IQR)
The video explains quartiles as data values that split a data set into quarters. It describes how to find quartiles by arranging observations in order and locating the median and other key points. The interquartile range (IQR) is introduced as a measure of spread, calculated by subtracting the first quartile from the third. An example using travel times is provided, showing how to find the quartiles and IQR, and highlighting the use of a calculator for efficiency.
📊 Constructing and Interpreting Box Plots
The script teaches how to construct a box plot using the five number summary (minimum, first quartile, median, third quartile, maximum). It explains the components of a box plot, including the box itself and the whiskers that extend to the minimum and maximum values. The process of constructing a box plot is demonstrated using a sample data set, and the video emphasizes the importance of understanding quartiles in this context.
🚫 Identifying Outliers Using Box Plots
The video concludes with a discussion on identifying outliers using box plots. It explains how to calculate the lower and upper fences based on the interquartile range (IQR) and how any data point outside these fences is considered an outlier. The process is illustrated by determining whether a travel time of 60 is an outlier, using the calculated IQR and quartiles from the previous example.
📐 Modified Box Plots for Outlier Representation
The final part of the script describes how to create a modified box plot when outliers are present. It explains that outliers are marked with an open circle on the plot and that the whisker extends to the next highest or lowest non-outlier data point. The process is demonstrated using a data set that includes an outlier, showing how to adjust the box plot accordingly.
🔚 Wrapping Up Chapter Three
The video script concludes with a summary of chapter three, highlighting the importance of understanding box plots, percentiles, and the identification of outliers. It provides a heads-up about potential homework and quiz questions related to these topics and encourages students to be vigilant in their studies for the upcoming chapter.
Mindmap
Keywords
💡Standard Deviation
💡Unusual Values
💡Empirical Rule
💡Z-Score
💡Percentile
💡Quartiles
💡Interquartile Range (IQR)
💡Box Plot
💡Outliers
💡Five Number Summary
Highlights
Introduction to identifying unusual values using standard deviation, with a rule of thumb for minimum and maximum usual values.
Explanation of how to calculate the minimum and maximum usual values using the mean and standard deviation.
Example 11 demonstrates the process of determining unusual pulse rates using the established rule of thumb.
Introduction to the empirical rule and its application to bell-shaped, symmetric data for interpreting data values.
Illustration of the empirical rule with IQ scores, showing the percentage of scores within one, two, and three standard deviations from the mean.
Clarification on the limitations of the empirical rule, emphasizing its use for bell-shaped and symmetric data only.
Explanation of z-scores as a measure of relative standing in a data set, indicating how many standard deviations a value is from the mean.
Calculation of z-scores for comparing heights of women and men, and interpretation of whether being six feet tall is unusual for each.
Introduction to percentiles as measures of location in a data set, dividing the data into 100 equal groups.
Method for finding the percentile of a specific data value and its significance in understanding data distribution.
Procedure for determining quartiles, which split data into quarters, and their role in understanding data spread.
Interquartile Range (IQR) calculation as a measure of data variation, found by subtracting the first quartile from the third.
Construction of a box plot using the five number summary (minimum, Q1, median, Q3, maximum) to visualize data distribution.
Identification of outliers using the box plot and the method for constructing a modified box plot when outliers are present.
Demonstration of how to use a calculator to enter data and find the five number summary for quick analysis.
Final summary of Chapter 3, emphasizing the importance of understanding box plots, quartiles, and the identification of outliers.
Transcripts
Browse More Related Video


5.0 / 5 (0 votes)
Thanks for rating: