Math 20 Lesson 3.5 Descriptive Measures for Populations, Z score Video 3
TLDRThis video script explains the concept of the z-score in statistics, detailing its calculation as the number of standard deviations a data point is from the mean. It illustrates how positive z-scores indicate values above the mean, while negative ones are below. The script provides examples of calculating z-scores for various observed values, emphasizing the importance of understanding their position relative to the mean.
Takeaways
- 📚 The standard score, or z-score, measures how many standard deviations a value is from the mean.
- 📈 Positive z-scores indicate values above the mean, while negative z-scores indicate values below the mean.
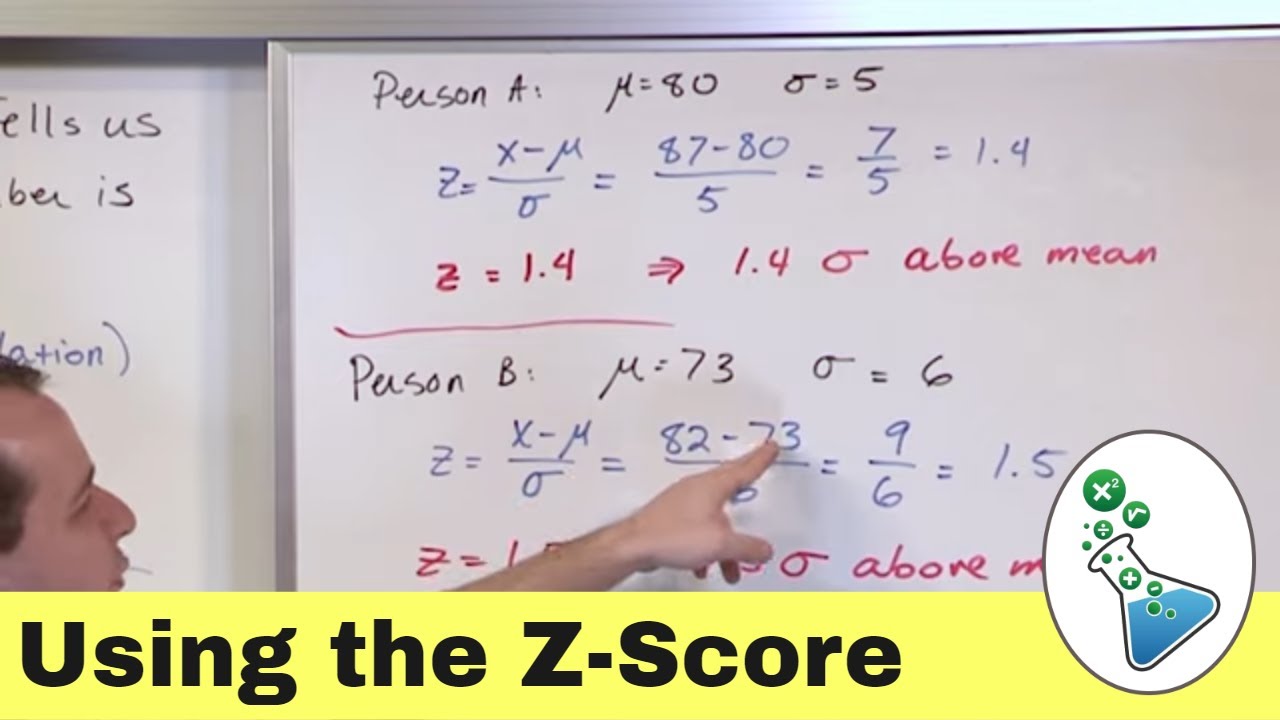
- 🔍 The formula for calculating the z-score is \( z = \frac{x - \bar{x}}{s} \), where \( x \) is the observed value, \( \bar{x} \) is the mean, and \( s \) is the standard deviation.
- 📉 At the mean, the z-score is zero because \( \frac{x - x}{s} = 0 \).
- 🔄 One standard deviation to the right of the mean results in a z-score of one, as \( \frac{s}{s} = 1 \).
- 🔄 Similarly, one standard deviation below the mean results in a z-score of negative one.
- 📊 The z-score tells you how many standard deviations a particular data point is from the mean.
- 🔢 Z-scores are often rounded to the nearest hundredth, with a typical range from -3 to +3.
- 📌 To find the z-score of a specific value, subtract the mean from the observed value and divide by the standard deviation.
- 📉 The z-score of 92, given a mean of 74.92 and a standard deviation of 14.20, is approximately 1.20.
- 📈 The z-score of 72, with the same mean and standard deviation, is approximately -0.206.
Q & A
What is the standard score or z-score in statistics?
-The standard score or z-score in statistics is a measure of how many standard deviations an element is from the mean. It indicates whether the value is above or below the mean, with positive scores for values above the mean and negative scores for values below.
What is the formula for calculating the z-score?
-The formula for calculating the z-score is \( z = \frac{x - \bar{x}}{s} \), where \( x \) is the observed value, \( \bar{x} \) is the mean of the sample, and \( s \) is the standard deviation of the sample.
What happens to the z-score when the observed value is equal to the mean?
-When the observed value is equal to the mean, the z-score is zero because the observed value minus the mean divided by the standard deviation results in zero over a non-zero number.
What is the z-score when the observed value is one standard deviation above the mean?
-When the observed value is one standard deviation above the mean, the z-score is one, as the calculation simplifies to \( \frac{s}{s} \), which equals one.
What is the z-score when the observed value is one standard deviation below the mean?
-When the observed value is one standard deviation below the mean, the z-score is negative one, as the calculation simplifies to \( \frac{-s}{s} \), which equals negative one.
How does the z-score help in understanding data?
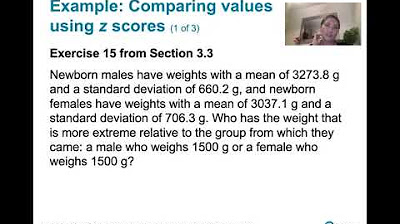
-The z-score helps in understanding how a particular data point compares to the mean in terms of standard deviations. It provides a standardized way to compare data points across different datasets.
What is the range of z-scores typically considered?
-The range of z-scores is typically considered to be from negative 3 to positive 3. This range covers most of the data distribution in a normal distribution.
How is the z-score of 92 calculated with a mean of 74.92 and a standard deviation of 14.20?
-The z-score of 92 is calculated as \( \frac{92 - 74.92}{14.20} \), which results in approximately 1.20.
What is the z-score of 72 with the same mean and standard deviation?
-The z-score of 72 is calculated as \( \frac{72 - 74.92}{14.20} \), which results in approximately -0.206.
How is the z-score of 92 calculated with a different mean of 72 and a standard deviation of 12?
-The z-score of 92 with a mean of 72 and a standard deviation of 12 is calculated as \( \frac{92 - 72}{12} \), which results in approximately 1.67.
What is the observed value x when the z-score is 1.8, the mean is 500, and the standard deviation is 100?
-When the z-score is 1.8, the mean is 500, and the standard deviation is 100, the observed value x is calculated as \( 1.8 \times 100 + 500 \), which equals 680.
Outlines
📊 Understanding Z-Scores in Statistics
This paragraph introduces the concept of the standard score or z-score in statistics. It explains how z-scores measure the number of standard deviations a data point is from the mean. Positive z-scores indicate values above the mean, while negative ones are below. The formula for calculating the z-score is given as ( z = (x - μ) / σ ), where ( x ) is the observed value, ( μ ) is the mean, and ( σ ) is the standard deviation. The paragraph also illustrates how the z-score changes as the observed value moves relative to the mean, with examples showing how values one standard deviation above or below the mean result in z-scores of +1 or -1, respectively. Additionally, it provides a method for finding the z-score of a specific value, such as 92, by subtracting the mean and dividing by the standard deviation.
🔍 Calculating Z-Scores for Various Values
This paragraph delves deeper into calculating z-scores for different values, demonstrating the process with several examples. It shows how to find the z-score for values like 92, 72, 63, 54, and 68 by subtracting the mean and dividing by the standard deviation. The results are then rounded to the nearest hundredth, with the range typically from -3 to +3. The examples highlight how values above or below the mean translate into positive or negative z-scores, respectively. The paragraph also discusses the implications of these z-scores, such as how a z-score of 1.8 corresponds to a test score that is 180 points above the mean of 500, given a standard deviation of 100.
📚 Solving for a Test Score Using Z-Score
In this paragraph, the focus shifts to solving for an unknown test score using a given z-score. The example uses a z-score of 1.8 and a standard deviation of 100 to find the test score. The process involves cross-multiplying and solving the equation ( 1.8 * 100 = x - 500 ), which leads to the conclusion that the test score ( x ) is 680. This demonstrates how z-scores can be used to determine specific values in a dataset, given the mean and standard deviation.
Mindmap
Keywords
💡Standard Score
💡Standard Deviation
💡Mean
💡Observed Value
💡Z-Score
💡Arithmetic
💡Position
💡Rounding
💡Range
💡Test Score
Highlights
The standard score or z-score is the number of standard deviations by which the value of a data point is above or below the mean.
Positive standard scores indicate values above the mean, while negative scores indicate values below the mean.
The formula for the z-score is \( z = \frac{x - \bar{x}}{s} \), where \( x \) is the observed value, \( \bar{x} \) is the mean, and \( s \) is the standard deviation.
At the mean, the z-score is zero because \( \frac{\bar{x} - \bar{x}}{s} = 0 \).
When the observed value is one standard deviation above the mean, the z-score is one.
When the observed value is one standard deviation below the mean, the z-score is negative one.
The z-score indicates how many standard deviations a data point is from the mean.
Another definition of the z-score is the position a particular value has relative to the mean, measured in standard deviations.
Z-scores are typically rounded to the nearest hundredth.
The range of z-scores is approximately from negative three to positive three.
To find the z-score of 92, subtract the mean (74.92) from the observed value and divide by the standard deviation (14.20).
The z-score of 92 is approximately 1.20.
The z-score of 72 is negative 0.206, indicating it falls below the mean.
The z-score of 92 with a different mean (72) and standard deviation (12) is approximately 1.67.
The z-score of 63 is negative 0.75, calculated as \( \frac{63 - 72}{12} \).
The z-score of 54 is approximately negative 1.757, calculated as \( \frac{54 - 74.2}{11.5} \).
The z-score of 68 is approximately negative 0.54, calculated as \( \frac{68 - 74.2}{11.5} \).
To find the test score \( x \) when given a z-score of 1.8, the mean (500), and the standard deviation (100), solve \( 1.8 = \frac{x - 500}{100} \) to get \( x = 680 \).
Transcripts
Browse More Related Video
Intro to Standard Z-Score & Normal Distribution in Statistics
3.3.1 Measures of Relative Standing and Boxplots - Computing and Interpretting z Scores

Statistics 101: Understanding Z-scores
ck12.org normal distribution problems: z-score | Probability and Statistics | Khan Academy

Elementary Statistics - Chapter 6 Normal Probability Distributions Part 1
Calculating correlation coefficient r | AP Statistics | Khan Academy
5.0 / 5 (0 votes)
Thanks for rating: