Position vs. Time Graph - Part 2
TLDRIn this educational video, Mr. Andersen explores the concept of position versus time graphs, focusing on how to interpret both straight and curved lines. He explains the significance of the slope in determining velocity, highlighting that a slope of zero indicates a stop in motion. Using The Moving Man simulation, he demonstrates how velocity changes with position over time, showing instances of constant velocity, deceleration, and acceleration in negative directions. The video also teases future content on converting velocity graphs to acceleration graphs, emphasizing the constant negative acceleration due to gravity.
Takeaways
- 📈 The slope of a line in a position versus time graph represents velocity.
- 🔄 A negative slope indicates a negative velocity, and a positive slope indicates a positive velocity.
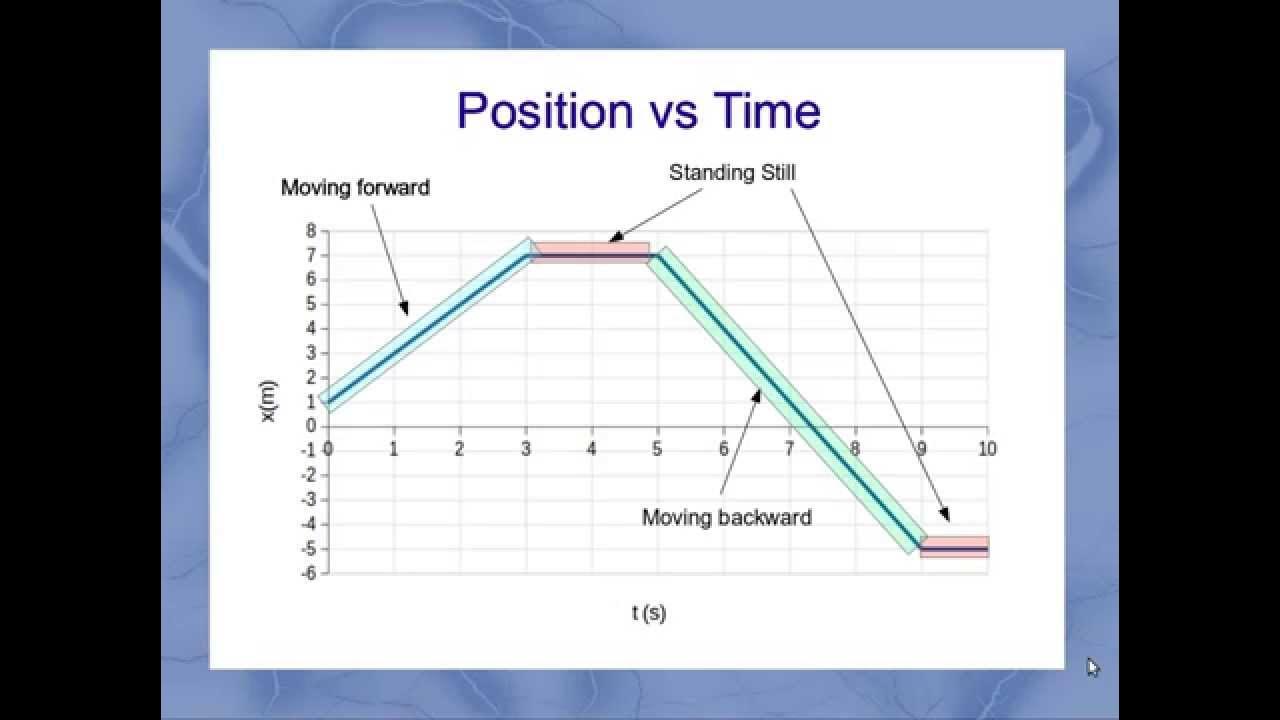
- 🚫 A slope of zero signifies that the velocity is zero, meaning the object is momentarily at rest.
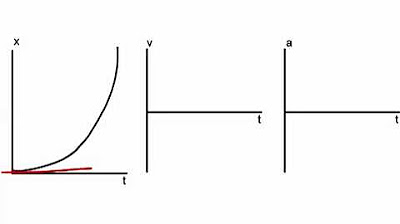
- 🎢 Dealing with curved lines in a position vs. time graph indicates changes in velocity (speeding up or slowing down).
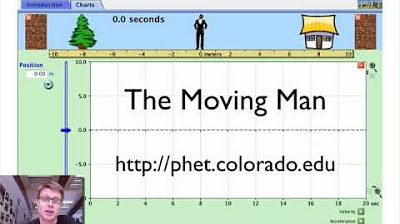
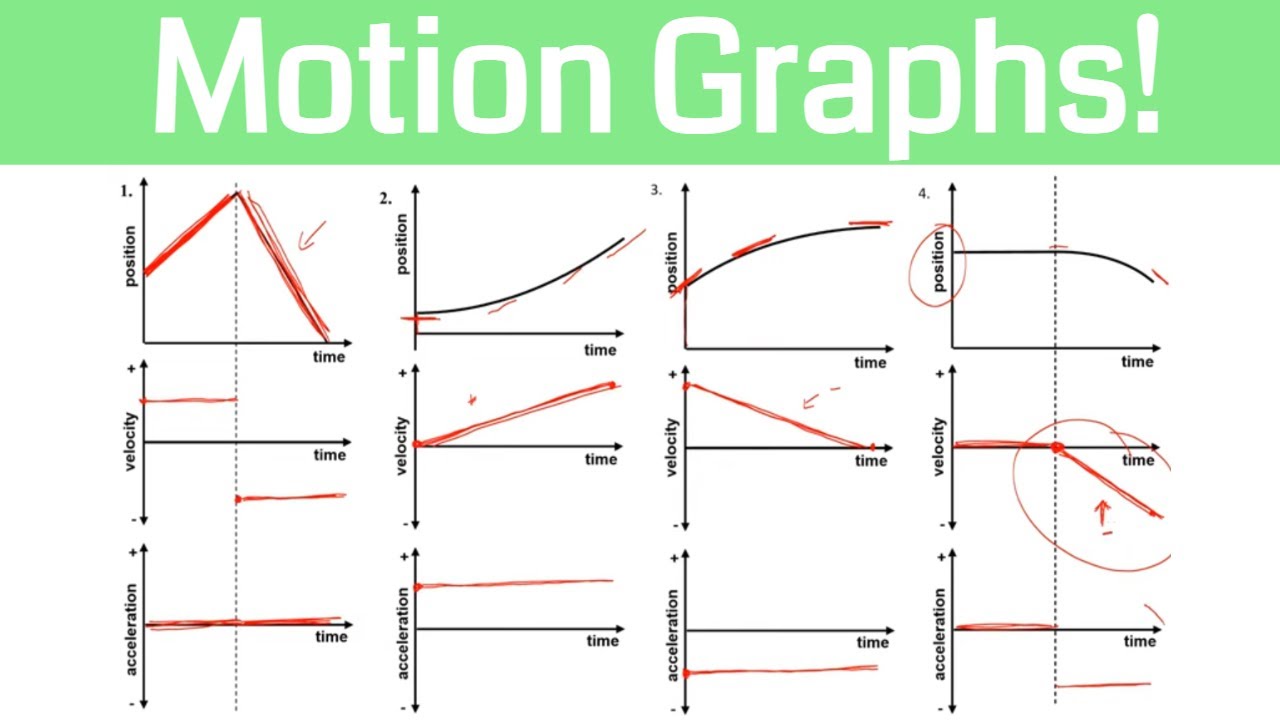
- 👤 The Moving Man simulation illustrates how position and velocity graphs change as an object moves.
- 🏃♂️ The velocity of The Moving Man can be determined by how the slope of the position graph changes over time.
- 📊 The position versus time graph can be used to infer the motion of an object, even when the motion involves changes in direction.
- 🔄 Understanding tangent lines at points of zero velocity helps in analyzing the motion from one point to another on the graph.
- 🔄 A 'magic pen' technique can be used to visually determine the changes in velocity by following the slope of the graph.
- 🏀 The concept can be applied to real-world scenarios like a bouncing ball, where the graph can show periods of rest and changes in direction.
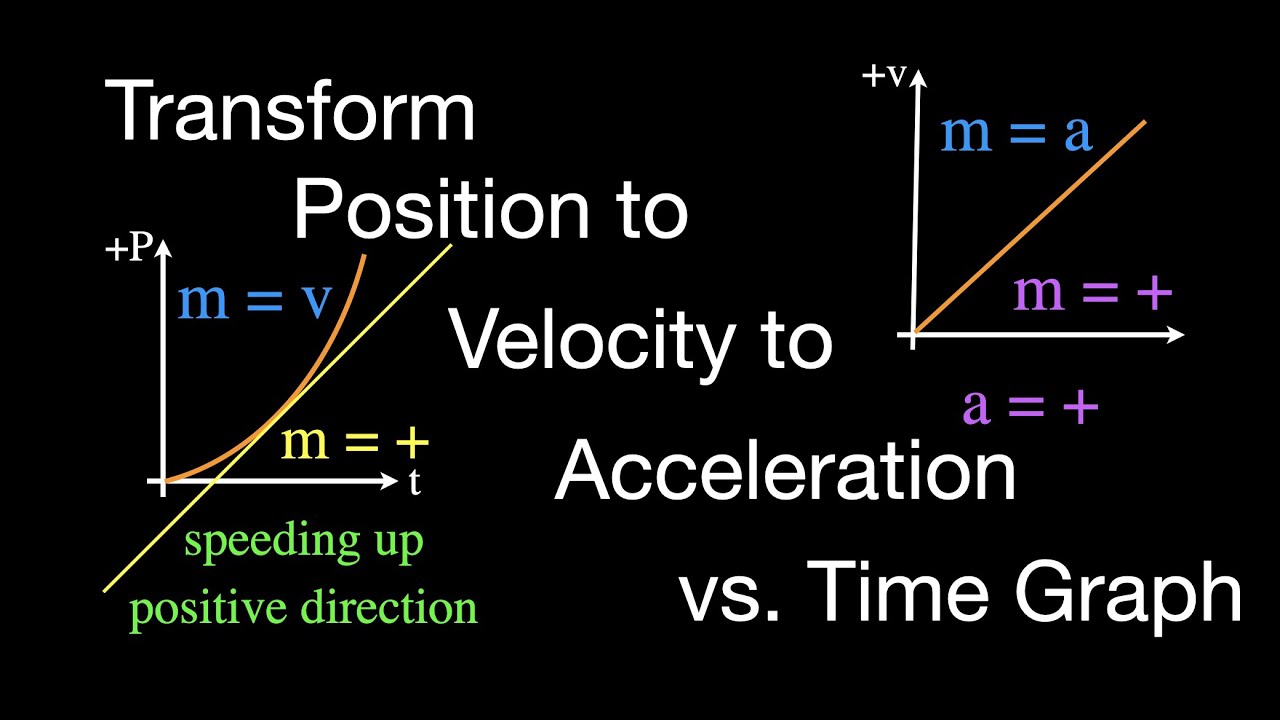
- 🚀 Future lessons will cover the transition from velocity versus time graphs to acceleration versus time graphs.
Q & A
What is the main topic of the video?
-The main topic of the video is the interpretation of position versus time graphs, specifically part 2 which focuses on understanding curved lines and their relation to velocity.
How does the slope of a line in a position versus time graph relate to velocity?
-The slope of a line in a position versus time graph directly represents the velocity of the object being graphed. A positive slope indicates positive velocity, while a negative slope indicates negative velocity.
What did Mr. Andersen demonstrate in the first video?
-In the first video, Mr. Andersen showed how to interpret a position versus time graph and how to create a velocity versus time graph from it, explaining that the slope of the line in the position graph equals velocity.
How does a straight vertical line in a position versus time graph affect the velocity?
-A straight vertical line in a position versus time graph indicates an instantaneous change in position, which results in a velocity of zero during that time interval because the slope is undefined.
What is the significance of a point where the slope is zero in a position versus time graph?
-A point where the slope is zero in a position versus time graph signifies that the object is momentarily at rest, as the velocity is zero at that specific time.
How does the 'magic pen' technique help in understanding velocity changes?
-The 'magic pen' technique involves holding a pen parallel to the line on the graph. As the pen moves along the graph, changes in the angle of the pen relative to the line indicate changes in velocity — upward and downward movements correspond to increasing positive and negative velocities, respectively.
What is the significance of the tangent line in the context of the position versus time graph?
-The tangent line to a position versus time graph at a particular point represents the instantaneous velocity at that point. It is the line that has the same slope as the graph at that point and is used to determine the velocity at that specific time.
How does the video use The Moving Man simulation to illustrate the concepts?
-The Moving Man simulation from the University of Colorado is used to visually demonstrate how changes in position over time (the position versus time graph) correspond to changes in velocity (the velocity versus time graph). It shows how an object's velocity changes as it speeds up, slows down, stops, and changes direction.
What happens to the velocity when the position versus time graph line flattens out?
-When the position versus time graph line flattens out, it indicates that the object has momentarily stopped or that the velocity is constant (neither increasing nor decreasing) at that point.
How does the video relate to real-world scenarios like a bouncing ball?
-The video explains that although the graphs can represent abstract scenarios, they can also be applied to real-world situations like a bouncing ball. The position versus time graph can show the back and forth motion, and the velocity graph can indicate when the ball is momentarily at rest (at the peak and trough of the bounce).
What is the next step after understanding velocity versus time graphs?
-After understanding velocity versus time graphs, the next step, as mentioned in the video, is learning how to create and interpret acceleration versus time graphs. This involves understanding how changes in velocity over time are represented graphically.
Outlines
📊 Understanding Position vs. Time Graphs
This paragraph introduces the concept of position versus time graphs, emphasizing the importance of understanding part 1 before proceeding. It explains how to interpret such graphs and how the slope of a line on the graph represents velocity. The example of a negative slope indicating negative velocity is given, along with the concept of zero slope representing zero velocity. The paragraph also introduces a simulation tool called The Moving Man from the University of Colorado to visually demonstrate changes in position and velocity over time.
🔍 Analyzing Velocity from Position Graphs
The focus of this paragraph is on analyzing velocity from position versus time graphs, especially when dealing with curved lines. It explains the use of tangent lines to determine points of zero velocity and introduces the concept of using a 'magic pen' to visually assess changes in velocity. The paragraph provides a detailed walkthrough of a position versus time graph, identifying points of zero velocity and explaining how the slope of the graph can indicate increasing or decreasing velocity, including negative values.
🎾 Graph Interpretation: Bouncing Ball Scenario
This paragraph delves into a more complex scenario of a bouncing ball, using position versus time graphs to illustrate the motion. It identifies points of zero velocity and explains the concept of the 'magic pen' to determine the velocity changes throughout the graph. The paragraph clarifies that despite the ball's back-and-forth motion, the acceleration due to gravity is consistently negative, indicating a downward acceleration towards the Earth's center. It concludes by hinting at future discussions on converting velocity versus time graphs to acceleration versus time graphs.
Mindmap
Keywords
💡Position vs. Time Graph
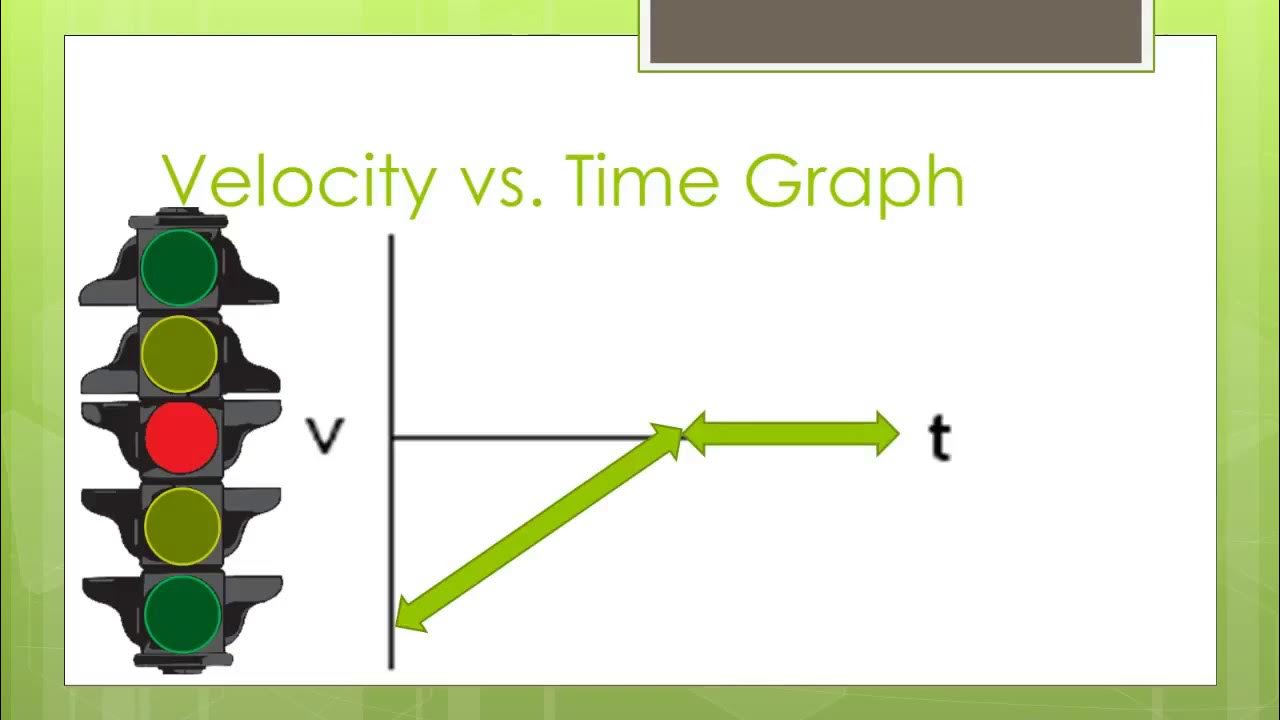
💡Velocity vs. Time Graph
💡Slope
💡The Moving Man
💡Negative Velocity
💡Zero Slope
💡Tangent Line
💡Acceleration
💡Constant Velocity
💡Instantaneous Velocity
Highlights
Mr. Andersen is presenting a continuation of his discussion on position versus time graphs, emphasizing the importance of understanding part 1 before proceeding.
The concept of slope in position versus time graphs is crucial as it represents velocity, with positive and negative slopes indicating direction of motion.
A zero slope indicates a velocity of 0, meaning the object is momentarily at rest during its motion.
The Moving Man simulation from the University of Colorado is introduced as a tool to visually understand the changes in position and velocity over time.
The demonstration of The Moving Man illustrates how changes in the slope of the position versus time graph correspond to changes in velocity.
The point where the slope flattens out indicates the object momentarily stops before changing direction.
The tangent line concept is introduced to explain how it can be used to determine the velocity at specific points on a curved position versus time graph.
A 'magic pen' technique is described, which visually indicates whether the object is speeding up, slowing down, or moving in the negative direction by following the graph's slope.
The method for analyzing curved position versus time graphs is demonstrated by identifying points of zero velocity and understanding the nature of the motion between these points.
The example of a bouncing ball's position versus time graph is used to illustrate the application of the concepts learned in analyzing more complex motion scenarios.
The video concludes with a teaser for future content, where the conversion from a velocity versus time graph to an acceleration versus time graph will be explored.
The significance of negative acceleration is touched upon, hinting at the constant downward acceleration due to gravity in all motion scenarios.
The transcript provides a comprehensive guide to visually interpreting and understanding the dynamics of motion through the analysis of position versus time graphs.
The practical application of the concepts is emphasized through the use of The Moving Man simulation, making the abstract principles more tangible and easier to grasp.
The use of visual aids and analogies, such as the 'magic pen', enhances the learning experience and helps in better understanding complex concepts.
The transcript serves as an educational resource for those interested in physics and the mathematical representation of motion.
The step-by-step breakdown of the concepts ensures that learners can follow along and apply the knowledge to a variety of motion scenarios.
Transcripts
5.0 / 5 (0 votes)
Thanks for rating: