Interpreting Motion Graphs
TLDRThis script delves into the interpretation of 1D motion graphs, focusing on position, velocity, and acceleration versus time. It explains that positive and negative positions indicate locations relative to a reference point, with zero indicating the reference itself. Horizontal sections in position graphs denote stillness, while slopes represent constant velocity. Curved lines indicate acceleration with upward-facing curves for positive and downward-facing for negative. The velocity graph mirrors these concepts, with flat segments representing constant velocity and slopes indicating acceleration. The acceleration graph is simpler, with constant acceleration shown by straight lines and no acceleration at the x-axis. The script emphasizes practice in correlating these graphs to understand motion dynamics accurately.
Takeaways
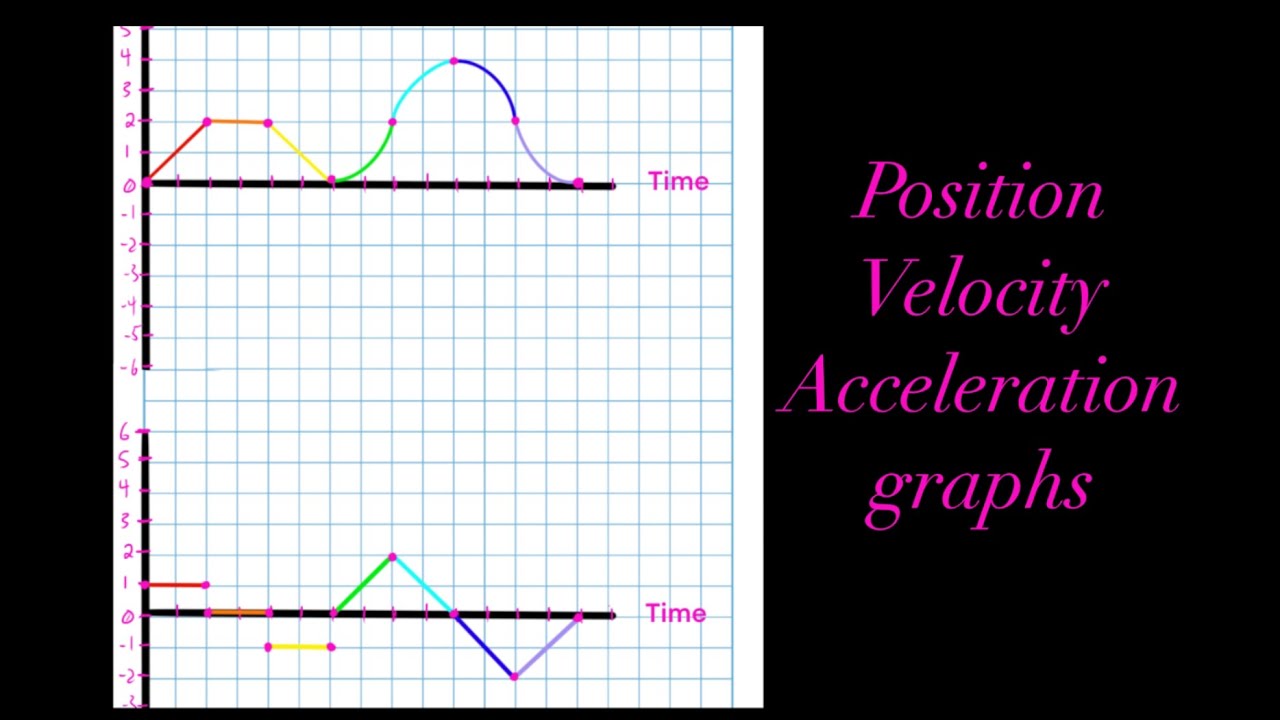
- 📈 Position vs. Time Graph: Positive positions indicate being in front of the reference point, while negative positions indicate being behind it.
- 🛑 Horizontal Sections: In the position vs. time graph, horizontal sections represent a constant position or standing still, with zero velocity.
- 🚀 Positive and Negative Slopes: Forward movement corresponds to positive slopes (positive velocity), and backward movement to negative slopes (negative velocity).
- 🔄 Curved Position Graphs: Curved lines in the position vs. time graph indicate changes in velocity and can signify direction changes at inflection points.
- 📶 Acceleration from Position Graph: Positive acceleration is shown by upward-facing curves, while negative acceleration is shown by downward-facing curves.
- 🔄 Velocity vs. Time Graph: The direction of movement (forward or backward) is indicated by the sign (positive or negative) of the velocity.
- 🎯 Zero Velocity: Crossing the x-axis in the velocity vs. time graph signifies a moment of zero velocity or not moving.
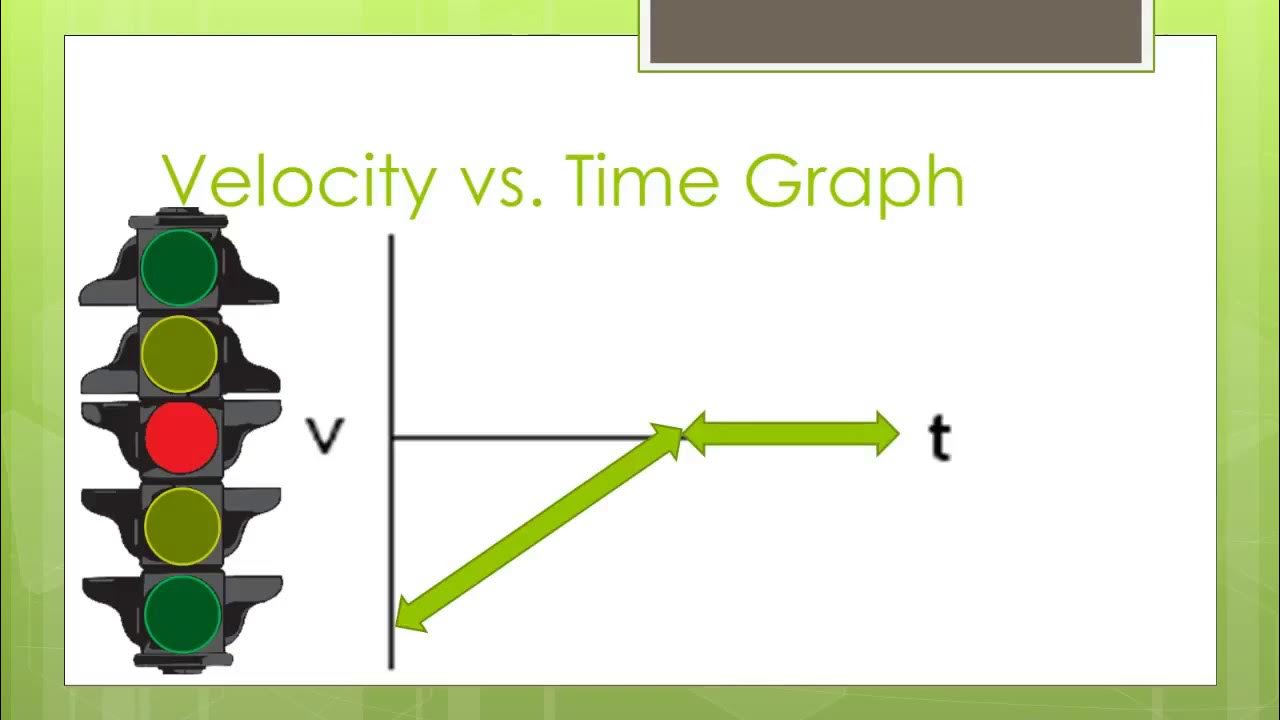
- 🚦 Constant Velocity: Flat segments in the velocity vs. time graph represent constant velocity and zero acceleration.
- 📈 Positive and Negative Acceleration: Positive acceleration is represented by upward-sloping lines, and negative acceleration by downward-sloping lines in the velocity vs. time graph.
- 🌐 Acceleration vs. Time Graph: No acceleration is represented by a line on the x-axis, constant acceleration by a horizontal line above for positive and below for negative.
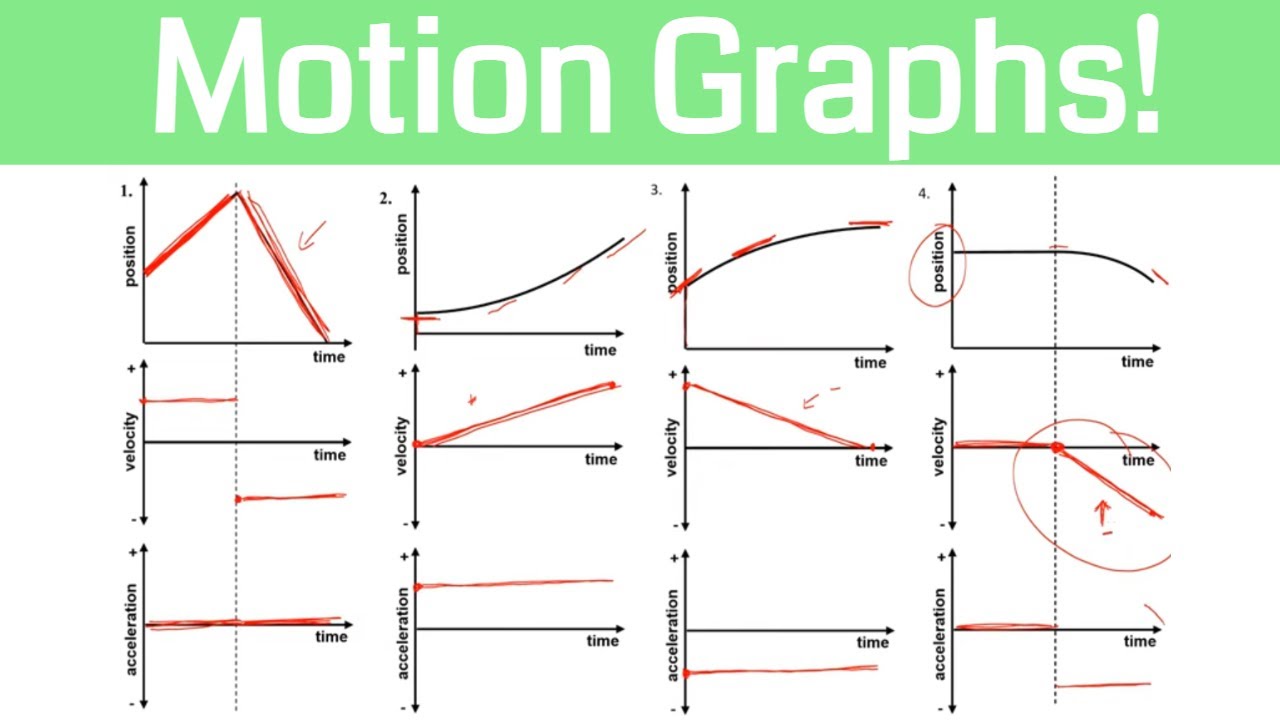
- 🔄 Matching Graph Properties: When analyzing multiple graphs (position, velocity, acceleration vs. time), ensure they all represent the same motion properties for consistency.
Q & A
What does the position versus time graph represent?
-The position versus time graph represents the location of an object at different points in time, with positive positions indicating in front of the reference point and negative positions behind the reference point.
How can you determine if an object is at rest in the position versus time graph?
-An object is at rest in the position versus time graph when there is a horizontal section, indicating a constant position or zero velocity.
What do positive and negative slopes in the position versus time graph indicate?
-Positive slopes in the position versus time graph indicate forward motion with positive velocity, while negative slopes indicate backward motion with negative velocity.
How can you identify a change in direction in the position versus time graph?
-A change in direction is identified by inflection points in the curve where it flattens out, indicating a transition from moving forward to moving backward or vice versa.
What does the shape of the curve in the position versus time graph tell you about acceleration?
-Curves facing upwards indicate positive acceleration, while curves facing downwards indicate negative acceleration. A flat section of the curve suggests zero acceleration.
What does the velocity versus time graph show?
-The velocity versus time graph shows the speed of an object at different points in time, with positive values indicating forward motion and negative values indicating backward motion.
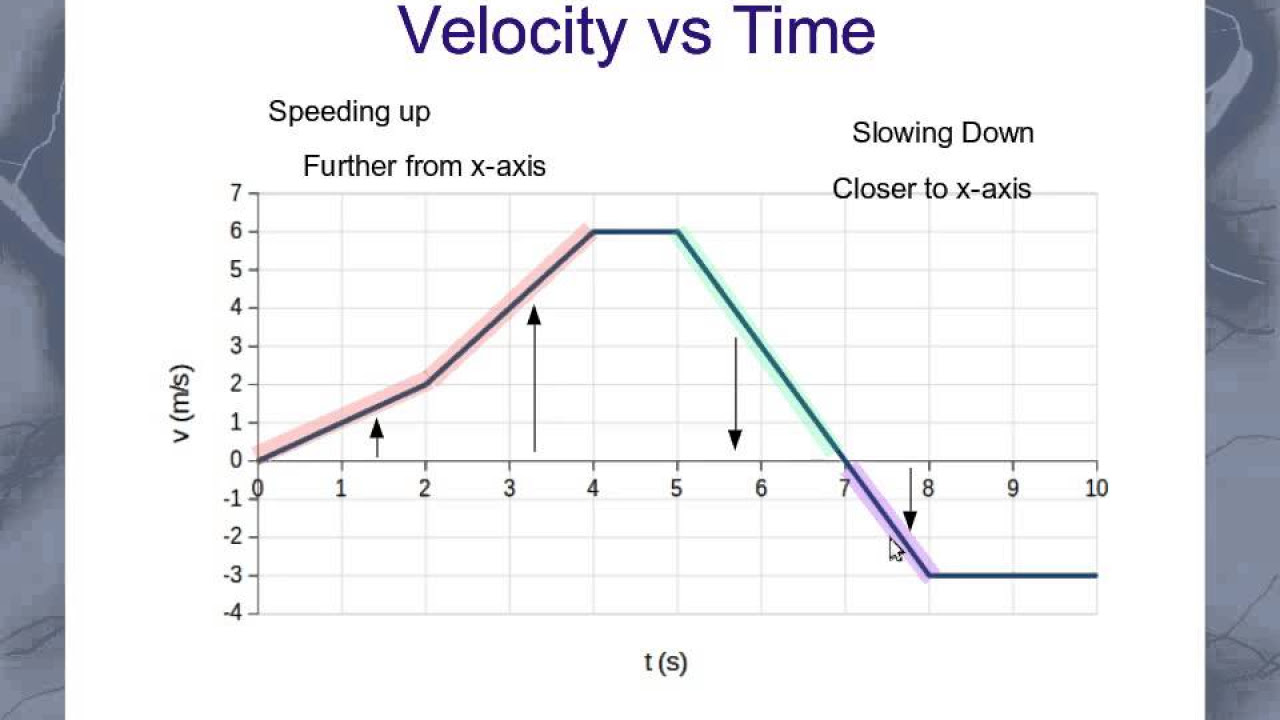
How can you tell if an object is speeding up or slowing down in the velocity versus time graph?
-An object is speeding up when the graph moves further away from the x-axis, and slowing down when it moves closer to the x-axis, regardless of the direction of motion.
What does a straight line segment in the velocity versus time graph represent?
-A straight line segment in the velocity versus time graph represents constant acceleration, with upward slopes indicating positive acceleration and downward slopes indicating negative acceleration.
What does the acceleration versus time graph represent?
-The acceleration versus time graph represents the rate of change of velocity over time, with no acceleration indicated by the line staying on the x-axis, and constant acceleration shown by a horizontal line above or below the axis.
How can you ensure that the x versus t, v versus t, and a versus t graphs all represent the same motion?
-All three graphs should have consistent motion properties, such as a positive constant acceleration in the a versus t graph being reflected by a positive slope in the v versus t graph and an upward sloping curve in the x versus t graph.
What is the key to accurately interpreting graphs?
-The key to accurately interpreting graphs is practice, which helps in quickly identifying the motion properties and the physical situation represented by the graph.
Outlines
📊 Understanding 1D Motion Graphs
This paragraph introduces the interpretation of three key graphs for 1D motion: position versus time, velocity versus time, and acceleration versus time. It explains the significance of positive and negative positions relative to a reference point and how horizontal sections in the position graph indicate a constant position or zero velocity. The paragraph further discusses how slopes in the graphs represent velocities and accelerations, with upward slopes indicating positive velocity or acceleration and downward slopes indicating the opposite. The concept of inflection points as indicators of direction change is also covered, along with a brief introduction to velocity and acceleration graphs, emphasizing the representation of constant velocity and acceleration through straight lines and the interpretation of speeding up or slowing down in relation to the x-axis distance.
🚀 Analyzing Velocity and Acceleration
The second paragraph delves deeper into the analysis of velocity and acceleration from their respective graphs. It describes how the distance of a graph line from the x-axis indicates the speed of the object, with movement away from the axis signifying acceleration and movement towards the axis indicating deceleration. The paragraph clarifies that speed is direction-independent, focusing on the rate of change in velocity. It also explains constant velocity and acceleration with horizontal sections and horizontal lines in their respective graphs. The paragraph concludes with a brief mention of the importance of aligning the motion properties across different graphs (x vs t, v vs t, a vs t) and encourages practice in graph interpretation for a better understanding of motion dynamics.
Mindmap
Keywords
💡1D motion
💡position versus time graph
💡velocity versus time graph
💡acceleration versus time graph
💡reference point
💡slope
💡inflection point
💡constant velocity
💡positive acceleration
💡negative acceleration
💡x-axis
Highlights
Interpreting 1D motion graphs can provide detailed information about an object's movement.
Position versus time graphs indicate an object's location relative to a reference point.
Positive positions represent locations in front of the reference point, while negative positions indicate behind it.
Horizontal sections in position versus time graphs signify that the object is stationary.
Forward movement corresponds to positive slopes, while backward movement corresponds to negative slopes in position versus time graphs.
Curved lines in position versus time graphs indicate changing directions due to acceleration or deceleration.
Positive acceleration is represented by curves facing upwards in position versus time graphs.
Negative acceleration is shown by curves facing downwards in position versus time graphs.
Velocity versus time graphs can show whether an object is moving forward or backward and at what speed.
Constant velocity is represented by flat sections in velocity versus time graphs.
Positive acceleration in velocity versus time graphs is indicated by lines sloping upwards.
Negative acceleration is shown by lines sloping downwards in velocity versus time graphs.
The distance of a line from the x-axis in velocity versus time graphs indicates whether the object is speeding up or slowing down.
Acceleration versus time graphs can show the presence and direction of constant acceleration.
No acceleration is represented by a line that stays on the x-axis in acceleration versus time graphs.
Comparing x versus t, v versus t, and a versus t graphs can help understand an object's complete motion profile.
Practice is necessary to quickly interpret graphs and understand the motion they represent.
Transcripts
Browse More Related Video
Position vs Time, Velocity vs Time & Acceleration vs Time Graph (Great Trick to Solve Every Graph!!)
Interpreting Velocity graphs
Position vs. Time Graph - Part 2
Position, Velocity, and Acceleration vs. Time Graphs

Translating Motion Graphs: Position, Velocity, and Acceleration - IB Physics
How to match motion graphs in physics (more examples)
5.0 / 5 (0 votes)
Thanks for rating: