Visualizing Motion Using Tape Charts and Motion Graphs | SCIENCE 7 QUARTER 3 MODULE 2 WEEK 3
TLDRThis educational video script introduces viewers to the concept of visualizing motion through graphs in physics, specifically motion graphs. It explains how to plot position versus time data on a Cartesian coordinate system to create a position-time graph. The script further discusses different types of graphs such as distance-time and displacement-time, and how the slope of these graphs can indicate an object's velocity and acceleration. The explanation includes examples of uniform velocity, zero velocity, and varying accelerations, highlighting the relationship between graph slopes and the motion characteristics they represent.
Takeaways
- 📊 Visualizing motion can be done using graphs in physics, known as motion graphs.
- 📈 A motion graph is a visual representation that uses lines to show relationships between two or more sets of measurements.
- 📝 Graphing paper with precise squares is typically used to accurately represent information in a graph.
- 🏀 To graph motion, plot data on a Cartesian coordinate system with time on the x-axis and position on the y-axis.
- 🎯 Plotting data involves finding the intersection of the vertical and horizontal lines for each data point.
- 🔍 A position-time graph can be used to describe the position of an object at any given time.
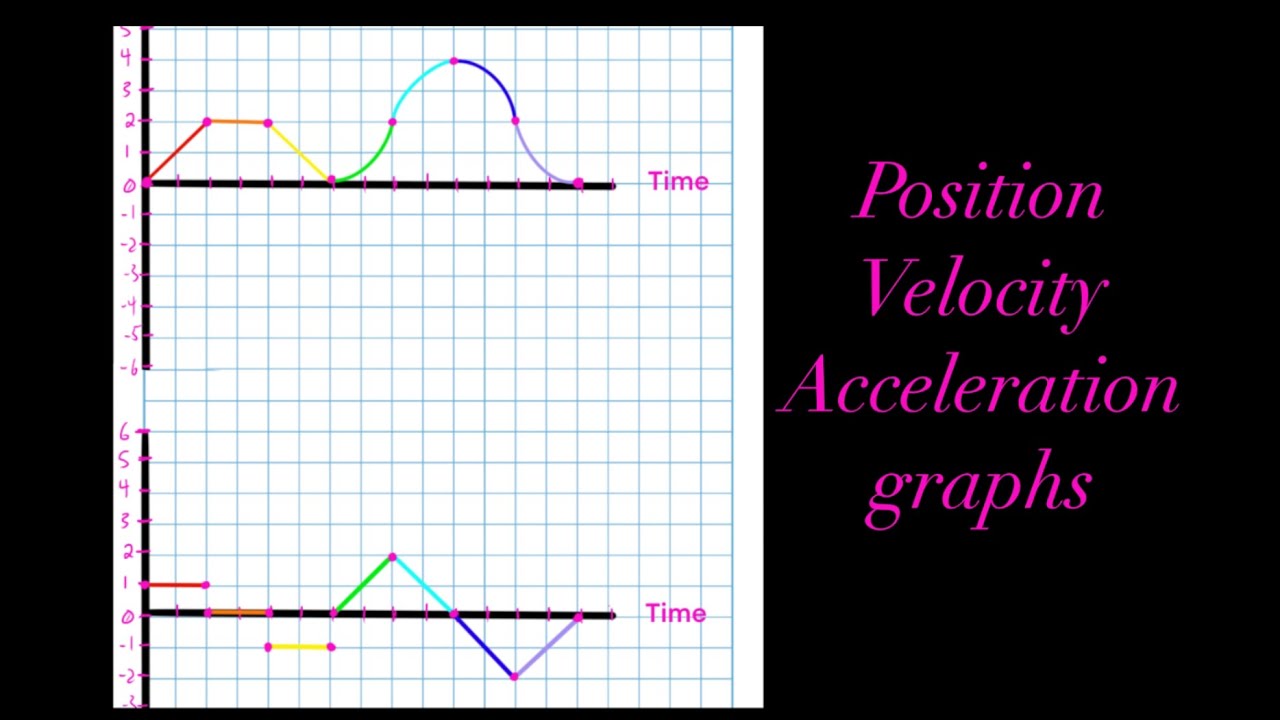
- 🚀 The slope of a position-time graph indicates the velocity of an object, with different slopes representing constant velocity, zero velocity, or changing velocity.
- 📉 A distance-time graph shows the relationship between the distance traveled by an object and the time taken.
- 📈 A displacement-time graph is used when the focus is on displacement rather than distance traveled.
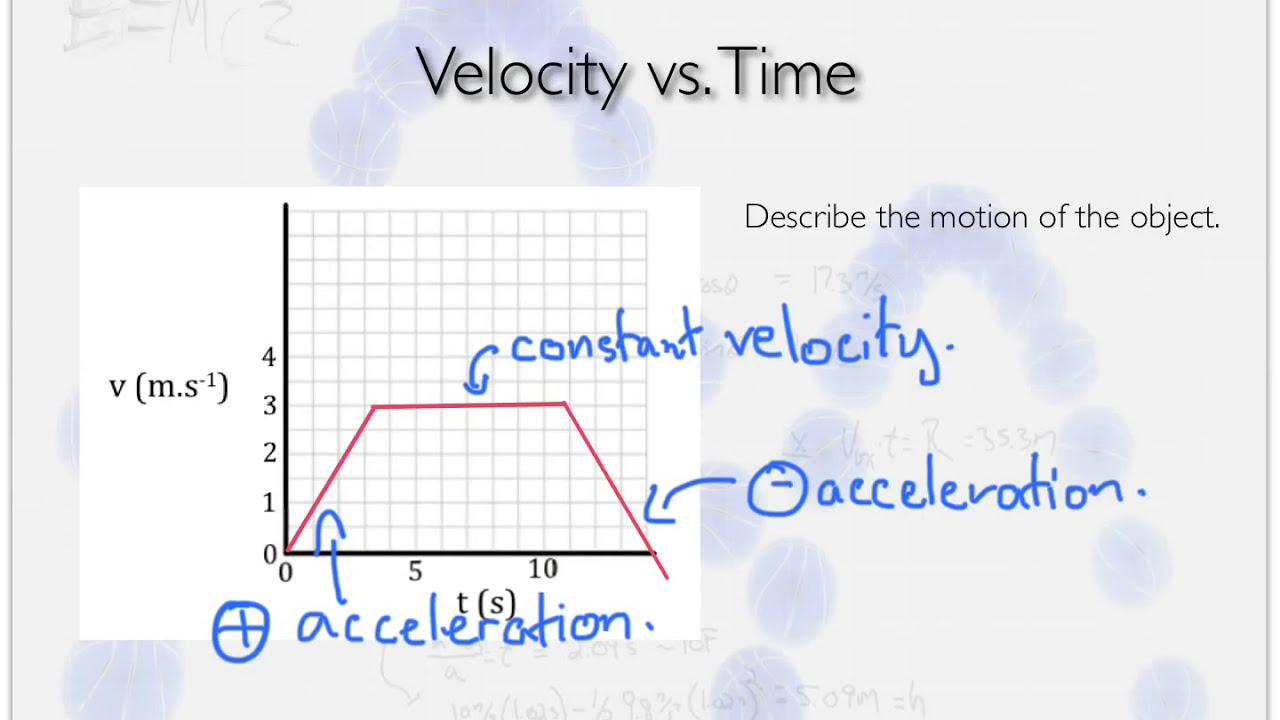
- 🔽 Velocity-time graphs illustrate changes in an object's acceleration, with slopes indicating constant or variable acceleration.
- 🌊 The next video will discuss waves, continuing the exploration of physical concepts.
Q & A
What is the main topic of the video?
-The main topic of the video is visualizing motion using graphs in physics, specifically motion graphs.
What is a motion graph in physics?
-A motion graph in physics is a visual representation that uses lines to show how two or more sets of measurements, such as position and time, are related to each other.
What type of paper is typically used to graph motion?
-Graphing paper with precise squares is typically used to accurately represent the information when graphing motion.
How is the position of a ball at a given time represented on a graph?
-The position of a ball at a given time is represented by plotting the time on the x-axis and the position on the y-axis, then connecting the points with a line.
What is a position-time graph?
-A position-time graph is a graphical representation that shows the position of an object at any given time, using the x-axis for time and the y-axis for position.
How can you find the position of an object at a specific time using a position-time graph?
-To find the position of an object at a specific time, you locate the point along the diagonal line where the vertical line at the specified time mark intersects, then find the horizontal line from that point of intersection that crosses the y-axis.
What is a distance-time graph?
-A distance-time graph is a type of motion graph where the x-axis represents time and the y-axis represents the distance traveled by the object.
What does the slope of a position-time graph represent?
-The slope of a position-time graph represents the velocity of an object, indicating how fast and in what direction the object is moving.
What does a uniform velocity look like on a position-time graph?
-A uniform velocity is represented by a straight line with a constant slope on a position-time graph, indicating that the object travels equal distances in equal time intervals without changing its direction.
What is a velocity-time graph?
-A velocity-time graph is a type of motion graph where the x-axis represents time and the y-axis represents the velocity of the object, showing how the object's velocity changes over time.
What does a curved line on a velocity-time graph indicate?
-A curved line on a velocity-time graph indicates that the object's velocity is changing, meaning the motion or speed of the object is not constant.
Outlines
📊 Visualizing Motion with Graphs
This paragraph introduces the concept of using graphs to visualize motion, specifically focusing on position-time graphs. It explains how to represent the motion of an object using lines on a graph with two axes, the x-axis for time and the y-axis for position. The process of plotting data points from a given table is described, where the position of a ball at different times is graphed. The paragraph emphasizes the importance of graphing paper for accurate representation and concludes by explaining how to interpret the graph to find the position of the object at any given time. It also introduces different types of graphs such as distance-time and displacement-time graphs, and touches on the concept of slope in a graph as it relates to the object's velocity and acceleration.
🚀 Understanding Velocity and Acceleration through Graphs
The second paragraph delves deeper into the analysis of motion through graphs, focusing on velocity-time graphs. It explains how the slope of a line in such a graph can indicate the acceleration of an object, with different types of slopes representing uniform acceleration, zero acceleration, increasing acceleration, and deceleration. The paragraph also discusses the interpretation of curved lines in a graph, which suggest that the object's velocity is constantly changing. The summary concludes with a teaser for the next video, which will cover the topic of waves, leaving the audience eager for more scientific insights.
Mindmap
Keywords
💡Visual Representation
💡Equate Diagram
💡Motion Graphs
💡Graphing Paper
💡Cartesian Coordinate
💡Position-Time Graph
💡Velocity
💡Acceleration
💡Displacement
💡Uniform Velocity
💡Deceleration
Highlights
Visualizing motion using graphs is an effective method in physics.
Graphs are visual representations that show relationships between sets of measurements.
A graphing paper with precise squares is used for accurate data representation.
The position of an object over time can be plotted on a graph with time on the x-axis and position on the y-axis.
A position-time graph can be used to describe the position of an object at any given time.
A distance-time graph represents the distance traveled by an object over time.
A displacement-time graph shows the object's displacement and time, indicating constant velocity if it's a straight line.
The slope of a position-time graph indicates the velocity of an object.
Constant or uniform velocity is indicated by a straight line slope in the position-time graph.
Zero velocity on a graph implies no change in the object's position or no movement.
A curved line in a graph signifies that the object's velocity is constantly changing.
A velocity-time graph shows how the object's velocity changes over time.
Uniform acceleration is represented by a straight line slope in a velocity-time graph.
Non-constant acceleration is indicated by a graph where the slope increases.
A decreasing slope in a graph signifies that the object is decelerating.
Understanding graph slopes is crucial for analyzing an object's motion.
The next video will discuss waves, continuing the exploration of physics concepts.
Transcripts
Browse More Related Video
Position vs Time, Velocity vs Time & Acceleration vs Time Graph (Great Trick to Solve Every Graph!!)
Graphs of Motion : Easy and Quick Summary

Velocity Time Graphs, Acceleration & Position Time Graphs - Physics
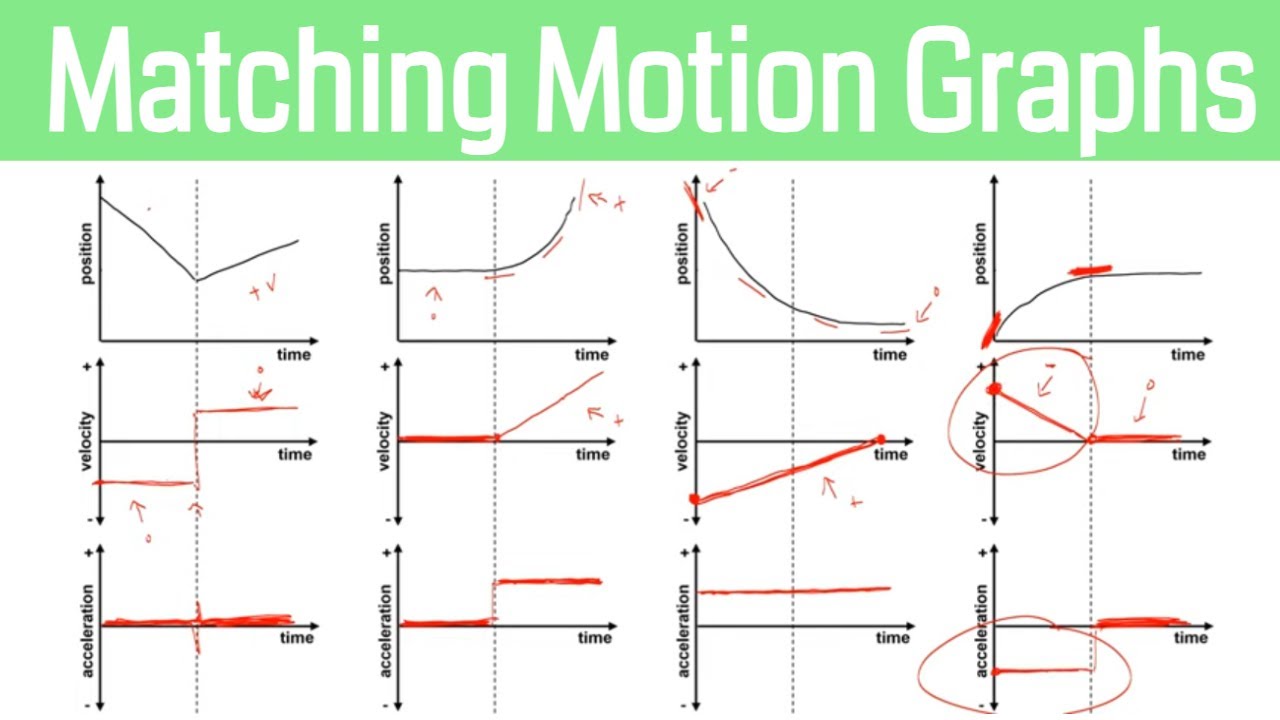
How to Match Motion Graphs in Physics
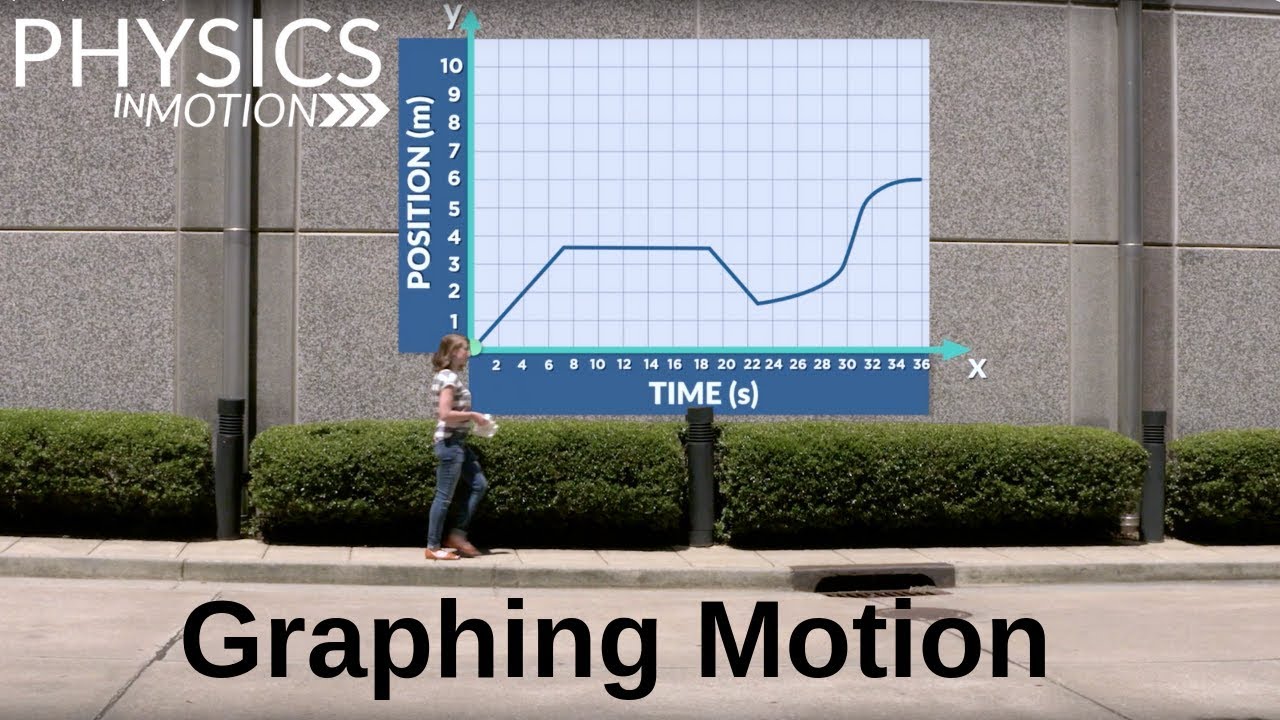
How Do You Graph Motion? | Physics in Motion

College Physics 1: Lecture 7 - Instantaneous Velocity
5.0 / 5 (0 votes)
Thanks for rating: