Graphing Motion
TLDRThe video script delves into the fundamentals of graphing kinematics equations, focusing on the interplay between position, velocity, and acceleration. It emphasizes the importance of understanding these physical quantities beyond mere graphing, highlighting how position denotes location with possible negative values, velocity reflects the rate of position change, and acceleration is the rate of velocity change. The video outlines the relationships between these quantities and their graphical representations, such as position-time graphs and velocity-time graphs, and explains how to interpret the slope and area under the curves to understand the physical behavior of an object in motion.
Takeaways
- 📍 Position in physics is a quantitative measure of an object's location, which can be positive or negative depending on the direction of motion.
- 🏃 Velocity is the rate of change of position with respect to time, indicating how fast and in which direction an object is moving, and can also be positive or negative.
- 🚀 Acceleration is the rate of change of velocity with respect to time, describing how quickly the velocity of an object changes, and can be positive or negative as well.
- 📈 Position vs. time graphs represent the object's location on the y-axis and time on the x-axis, with the slope of the graph equaling the object's velocity.
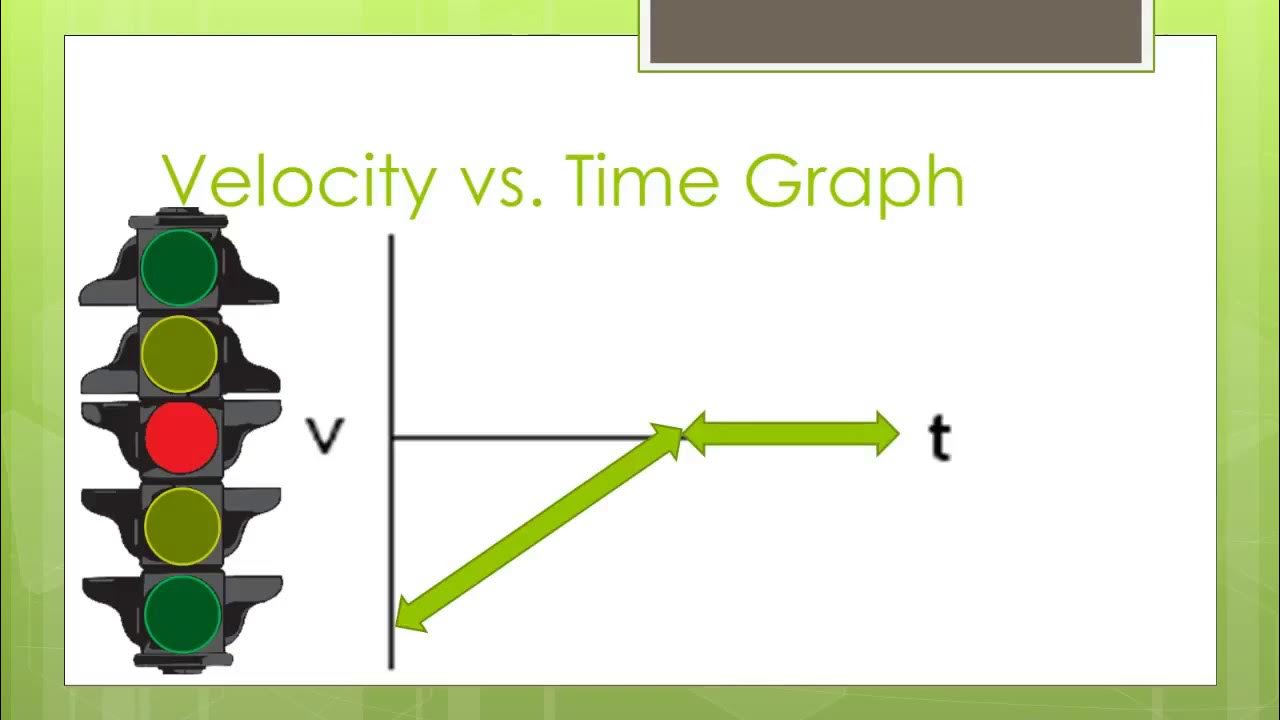
- 🏎️ Velocity vs. time graphs show the speed and direction of an object at each moment in time, with the y-axis representing velocity and the slope indicating acceleration.
- 🔄 The area under the velocity vs. time graph represents the change in position (delta x), which is the product of velocity and time.
- 🔽 Acceleration vs. time graphs depict how the velocity changes over time, with the y-axis representing acceleration and the slope representing the rate of change of velocity (jerk).
- 🔄 The area under the acceleration vs. time graph represents the change in velocity (delta v), calculated by multiplying the acceleration by the time interval.
- 📊 Graphing these kinematic quantities helps in understanding their relationships and the motion of the object, beyond just plotting the functions.
- 🌐 In constant acceleration scenarios, velocity vs. time graphs will show straight lines, while non-constant acceleration may result in more complex curves.
- 🔢 Understanding the signs and relationships between position, velocity, and acceleration is crucial for accurately interpreting and predicting an object's motion.
Q & A
What is the primary focus of the video?
-The primary focus of the video is to understand the graphing of kinematics equations, specifically position, velocity, and acceleration, and to know what these values mean in the context of physics.
How is position represented in physics?
-In physics, position is represented with a number that indicates the location of an object. It can be positive or negative, with the sign indicating the direction from a reference point.
What is the definition of velocity?
-Velocity is the rate at which an object's position changes over time. It can be positive or negative, indicating the direction of motion relative to a chosen positive direction.
How does acceleration relate to velocity?
-Acceleration is the rate at which velocity changes. It can also be positive or negative, indicating whether the object is speeding up (if acceleration and velocity have the same sign) or slowing down (if they have opposite signs).
What is the significance of the slope in a position versus time graph?
-The slope in a position versus time graph represents the velocity of the object. A constant slope indicates a constant velocity, while a changing slope indicates that the velocity is changing.
What does the area under the velocity versus time graph represent?
-The area under the velocity versus time graph represents the change in velocity (delta v) multiplied by the time interval, which gives the change in position (delta x).
What is the relationship between the slope of a velocity versus time graph and acceleration?
-The slope of a velocity versus time graph is directly equivalent to acceleration. A positive slope indicates positive acceleration, and a negative slope indicates negative acceleration.
Why can't an instantaneous change in velocity be represented accurately on a graph?
-An instantaneous change in velocity would require an infinite acceleration, which is not physically possible. Therefore, such a change cannot be accurately represented on a graph, which is based on realistic, gradual changes in velocity over time.
How can you determine the direction of motion from a velocity versus time graph?
-The direction of motion is determined by the sign of the y-value on the velocity versus time graph. A positive y-value indicates motion in the positive direction, while a negative y-value indicates motion in the negative direction.
What is the significance of the slope in an acceleration versus time graph?
-The slope in an acceleration versus time graph represents the rate of change of velocity with respect to time, known as jerk. However, at this level of study, jerk is not typically considered due to the complexity of the math involved.
How does the shape of the velocity graph relate to the shape of the acceleration graph?
-The shape of the velocity graph directly influences the shape of the acceleration graph. The slope of the velocity graph at any point is the acceleration at that point. Therefore, changes in the velocity graph's slope correspond to changes in acceleration.
What is the importance of understanding the relationships between position, velocity, and acceleration?
-Understanding the relationships between position, velocity, and acceleration is crucial for analyzing and predicting the motion of objects. It provides a deep understanding of how these quantities interact and influence each other in the context of kinematics.
Outlines
📈 Introduction to Graphing Kinematics Quantities
This paragraph introduces the concept of graphing kinematics equations, emphasizing the importance of understanding the meaning behind position, velocity, and acceleration values. It explains that position represents location and can be positive or negative, indicating direction. Velocity is defined as the rate of position change over time, which can also be positive or negative depending on the direction of motion. Acceleration is described as the rate of change of velocity, which can indicate speeding up (same sign as velocity) or slowing down (opposite sign as velocity). The paragraph sets the stage for understanding the relationships between these quantities and how they will be graphically represented.
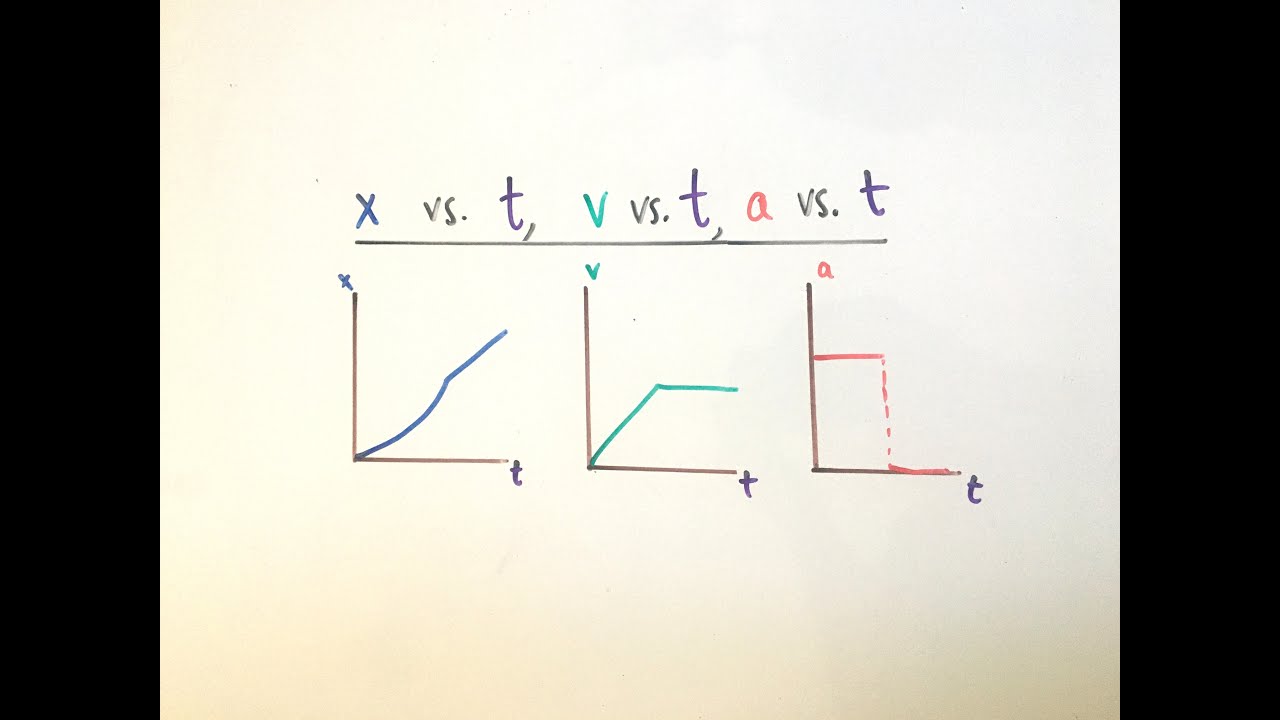
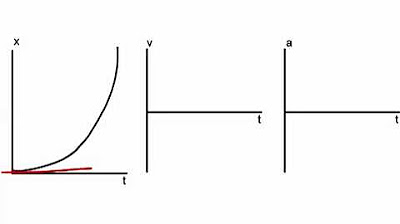
📊 Graphing Position, Velocity, and Acceleration
The paragraph delves into the specifics of graphing position, velocity, and acceleration over time. It explains that position versus time graphs use the y-axis to represent an object's location and the x-axis for time, with the slope indicating velocity. The area under the curve in these graphs represents the change in position (delta x). Velocity versus time graphs show the object's speed and direction at each moment, with the y-axis representing velocity and the slope indicating acceleration. The area under the velocity curve equals the change in velocity (delta v). Lastly, acceleration versus time graphs have acceleration on the y-axis, and the area under this curve would represent the change in velocity if acceleration were not constant, which is a concept beyond the scope of the class.
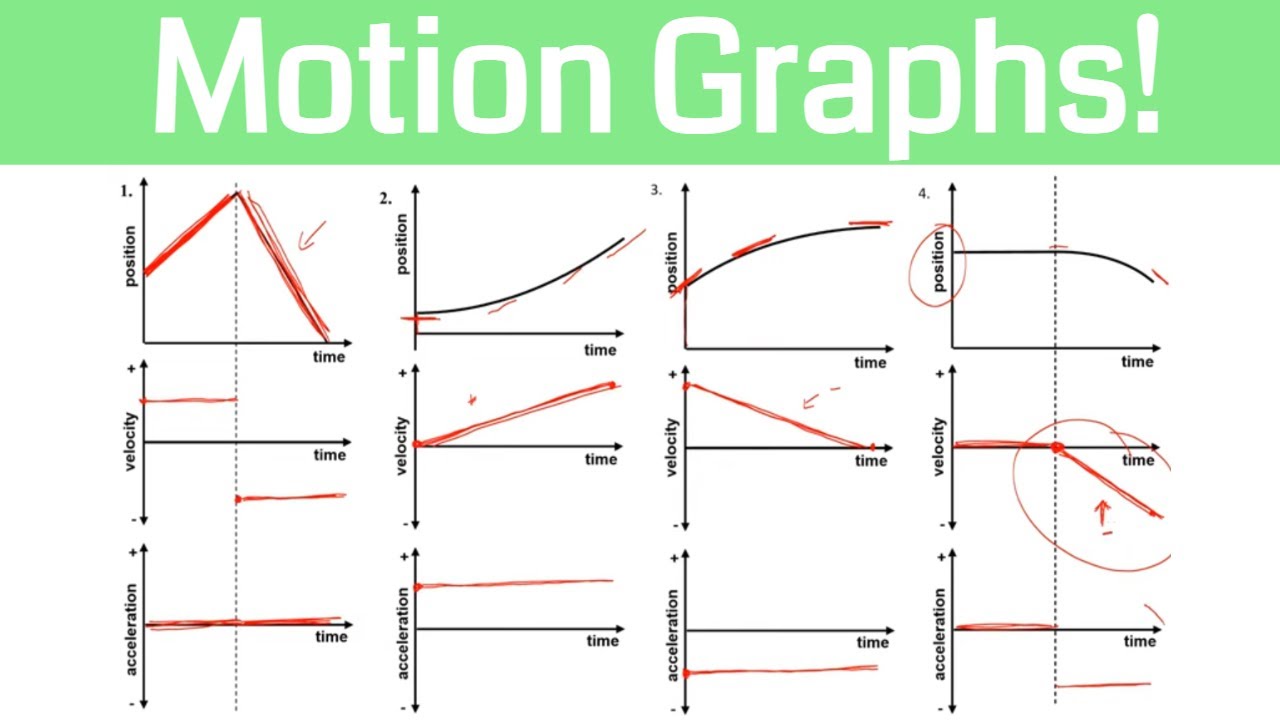
🖌️ Practicing Graph Types and Interpretations
This section provides a practical walkthrough of graphing different scenarios involving position, velocity, and acceleration. It describes how to interpret the slope and curvature of the graphs to understand the physical quantities' behavior over time. The paragraph covers constant velocity and acceleration, as well as instantaneous changes in velocity, which are represented by sharp changes in the graphs. It emphasizes the importance of understanding the gradual changes in these quantities and how they are represented graphically.
📈 Analyzing Graphs of Velocity and Acceleration
The paragraph focuses on analyzing velocity and acceleration graphs, explaining how the slope of the velocity graph represents the constant rate of change of velocity and how the shape of the graph reflects the object's motion. It discusses the relationship between the velocity graph's slope and the acceleration graph, indicating that a constant slope in the velocity graph corresponds to a constant acceleration. The paragraph also addresses the complexity of non-constant acceleration scenarios and how they would require calculus for a full understanding, which is beyond the class's scope.
🔄 Understanding the Relationships Between Kinematics Quantities
This paragraph concludes the discussion by reiterating the importance of understanding the interplay between position, velocity, and acceleration. It highlights that graphing these quantities is not just about plotting them but also about grasping their meanings and how they influence each other. The paragraph emphasizes that a deep understanding of these relationships is crucial for accurately interpreting and predicting an object's motion in kinematics.
Mindmap
Keywords
💡Position
💡Velocity
💡Acceleration
💡Graphing
💡Slope
💡Direction
💡Rate
💡Time
💡Delta X
💡Jerk
Highlights
The video discusses graphing kinematics equations, focusing on position, velocity, and acceleration.
Understanding the meaning behind these values is emphasized over just graphing the functions.
Position in physics is always quantified with a number, potentially negative, to indicate direction.
Velocity is defined as the rate of position change and can be positive or negative.
Acceleration is the rate of velocity change, which can also be positive or negative.
If velocity and acceleration have the same sign, the object is speeding up.
If velocity and acceleration have opposite signs, the object is slowing down.
Position versus time graphs are the simplest and easiest to understand.
The slope of a position versus time graph represents velocity.
Velocity versus time graphs show the object's speed and direction at each moment.
The area under the velocity versus time curve represents the change in position (delta x).
Acceleration versus time graphs have acceleration as the y-value and the area under the curve represents the change in velocity (delta v).
The video provides a practice exercise to translate between different types of graphs.
The relationship between the graphs is based on the physical understanding of motion, not just mathematical representation.
The video emphasizes the importance of understanding the physical concepts behind the graphs.
Transcripts
Browse More Related Video


5.0 / 5 (0 votes)
Thanks for rating: