How to Match Motion Graphs in Physics
TLDRThe video script discusses the concept of matching motion graphs, focusing on the relationship between position versus time, velocity versus time, and acceleration versus time graphs. It explains how the slope of the position-time graph represents velocity and how changes in this slope indicate acceleration. The video also introduces the concept of 'jerk' and emphasizes that the direction of acceleration relative to velocity determines whether an object is speeding up or slowing down. The key takeaway is understanding that the direction of velocity and acceleration together dictate the object's change in speed.
Takeaways
- 📈 The slope of the position vs. time graph (x vs. t) represents velocity.
- 📉 A constant negative slope in the position graph indicates a constant negative velocity.
- 🔄 An abrupt change in the position graph, indicated by a dotted line, is referred to as 'jerk', representing a sudden change in velocity.
- 📊 A positive slope in the position graph corresponds to a positive velocity, with the slope indicating the rate of change.
- 🚫 Ignoring 'jerk' sections, the acceleration graph is flat where the velocity graph is flat, indicating zero acceleration.
- 🔄 The slope of the velocity vs. time graph represents acceleration.
- 📈 A velocity graph with a slope of zero indicates uniform acceleration or deceleration.
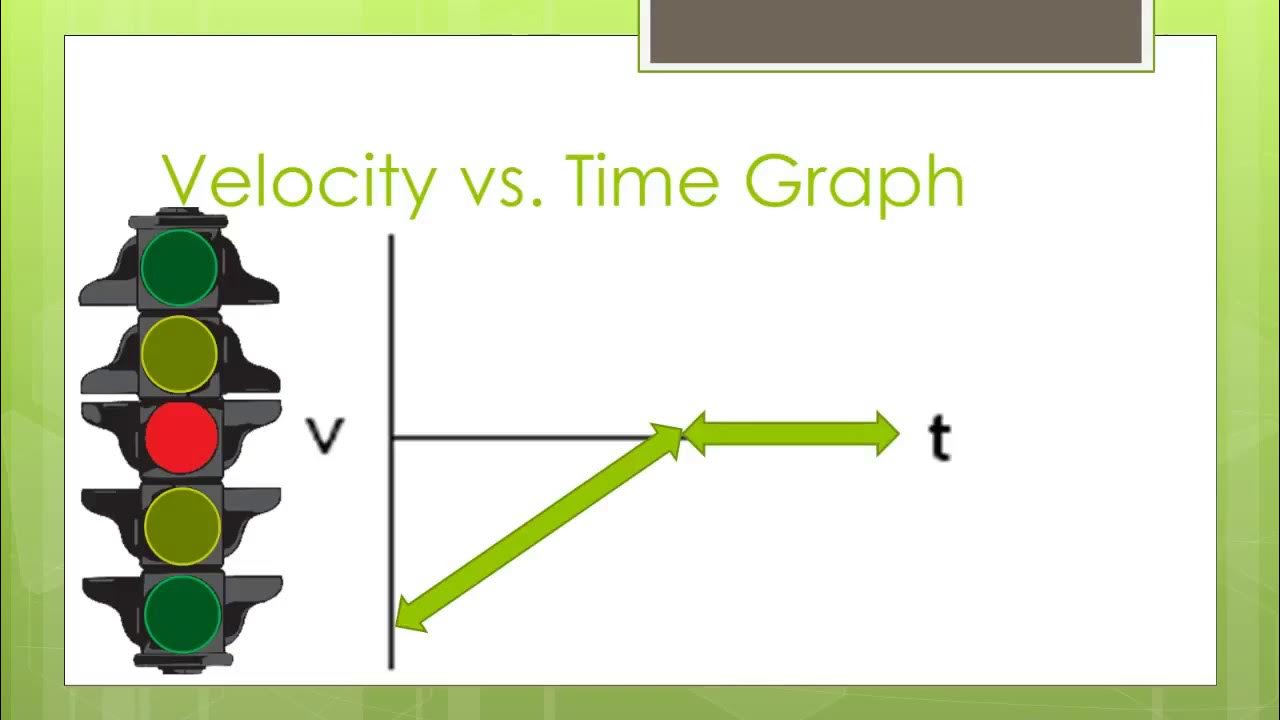
- 🚦 The direction of acceleration relative to the direction of velocity determines whether an object is speeding up or slowing down.
- 😃 The term 'frowny face graph' is used to describe situations where the velocity vs. time graph is approaching zero, indicating the object is slowing down.
- 📊 The key to understanding if an object is speeding up or slowing down lies in the comparison of the directions of velocity and acceleration.
Q & A
What is the relationship between a position versus time graph and velocity versus time graph?
-The slope of the position versus time graph (x vs. t) represents the velocity. A constant slope indicates a constant velocity, while a changing slope indicates a change in velocity.
How does a negative slope in a position versus time graph translate to velocity?
-A negative slope indicates that the object has a negative velocity, meaning it is moving in the opposite direction of the positive axis on the graph, and its speed does not change.
What is 'jerk' in the context of motion graphs?
-Jerk is a term used to describe a sudden change in velocity. It is typically represented by a sharp change in the slope of a motion graph.
How can you determine if an object is speeding up or slowing down based on the velocity versus time graph?
-An object is speeding up when the velocity versus time graph is moving away from zero, indicating an increase in speed. It is slowing down when the graph is approaching zero, indicating a decrease in speed.
What is the relationship between the slope of a velocity versus time graph and the acceleration versus time graph?
-The slope of the velocity versus time graph represents acceleration. A constant slope in the velocity graph indicates a constant acceleration, which is reflected as a straight line in the acceleration versus time graph.
How does the direction of velocity and acceleration determine if an object is speeding up or slowing down?
-An object speeds up when the direction of acceleration is the same as the direction of velocity. It slows down when the acceleration is in the opposite direction of the velocity.
What does a positive acceleration mean when all velocities are negative?
-A positive acceleration with all negative velocities means the object is slowing down. The positive acceleration indicates that the object's speed is decreasing in the negative direction (e.g., moving left or upwards on a graph).
What is the significance of the term 'constant uniform acceleration' in the context of motion graphs?
-Constant uniform acceleration (UAM) means that the acceleration does not change in magnitude or direction over time. This results in straight lines in the velocity versus time graph, indicating a uniform change in velocity.
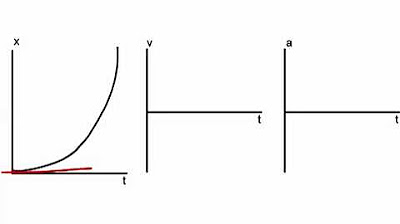
How can you predict the acceleration from a position versus time graph?
-The acceleration can be predicted by analyzing the slope of the velocity versus time graph, which is derived from the position versus time graph. The change in slope of the velocity graph represents the acceleration.
What does the steepness of the slope in a position versus time graph indicate?
-The steepness of the slope in a position versus time graph indicates the rate of change of velocity. A steeper slope means a quicker change in velocity, while a less steep or flat slope indicates a slower change or no change in velocity.
How does the direction of the slope in a position versus time graph relate to the direction of motion?
-The direction of the slope in a position versus time graph indicates the direction of motion. A positive slope means the object is moving in the positive direction of the axis, while a negative slope means the object is moving in the opposite direction.
Outlines
📈 Understanding Motion Graphs
This paragraph introduces the concept of matching motion graphs, specifically position versus time, velocity versus time, and acceleration versus time graphs. It explains the relationship between the slope of the position-time graph (indicating velocity) and how it translates to the velocity graph. The video also touches on the concept of 'jerk' as a sudden change in velocity and how to interpret different slopes on the position graph to determine if the object is speeding up or slowing down. The key takeaway is understanding that the slope of the position graph equals velocity and the slope of the velocity graph equals acceleration.
🚀 Analyzing Constant and Variable Acceleration
The second paragraph delves into the analysis of constant and variable acceleration through the interpretation of position versus time graphs. It describes how to determine if an object is speeding up or slowing down by comparing the direction of velocity and acceleration. The paragraph emphasizes that acceleration indicates the change in velocity, not necessarily the speed itself. It introduces the concept of the 'frowny face graph' to illustrate the relationship between the direction of acceleration and velocity and how it affects the object's speed. The summary highlights the importance of understanding whether acceleration and velocity are in the same or opposite directions to determine the object's speeding up or slowing down.
🔄 Transitions in Motion and Direction
The final paragraph focuses on the transitions in an object's motion, particularly when it changes direction. It explains how to interpret a position graph that includes a transition from positive velocity to zero and then to negative velocity. The paragraph clarifies that the sign of velocity indicates direction rather than speed, and that an object can speed up or slow down regardless of the sign of its velocity. The summary underscores the importance of recognizing when velocities and accelerations are in the same or opposite directions to understand if the object is speeding up or slowing down during different segments of its motion.
Mindmap
Keywords
💡motion graphs
💡slope
💡velocity
💡acceleration
💡constant uniform motion
💡jerk
💡direction
💡speeding up
💡slowing down
💡positive quadrant
💡negative quadrant
Highlights
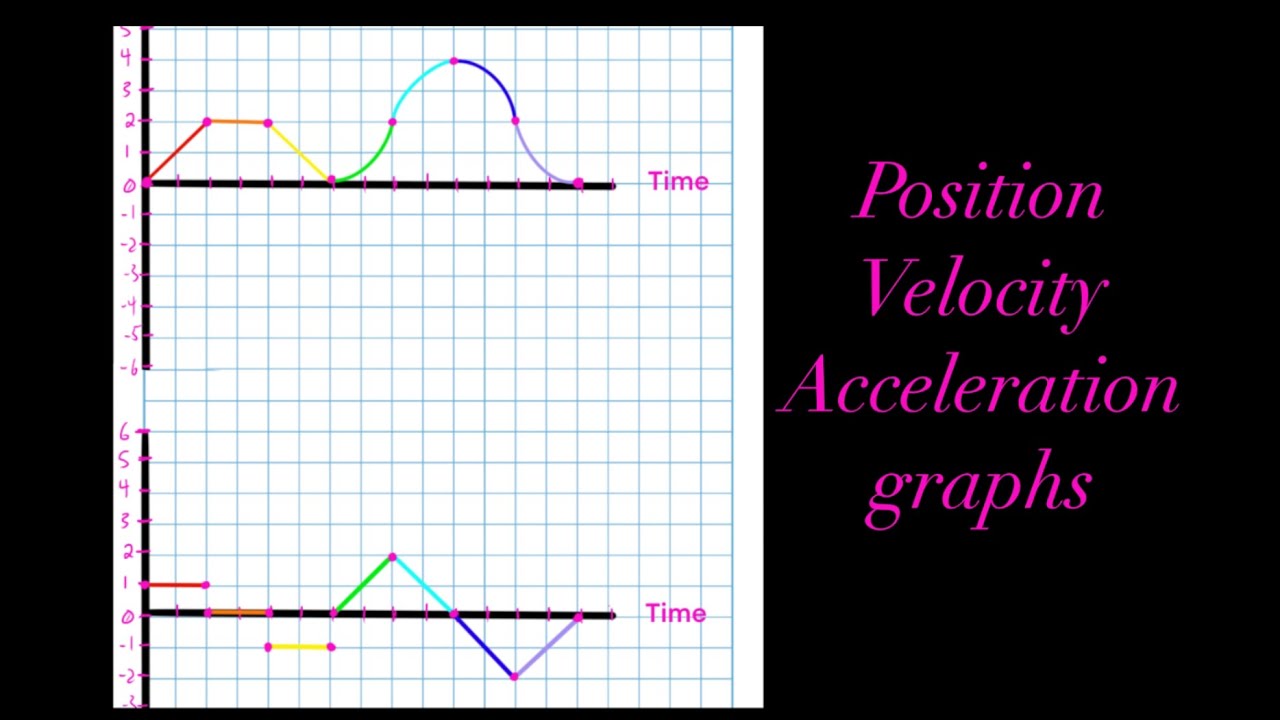
The video discusses the process of matching motion graphs, specifically position vs. time, velocity vs. time, and acceleration vs. time graphs.
The slope of the position vs. time graph (x vs. t) represents velocity.
A constant negative slope in the position graph indicates a constant negative velocity.
An abrupt change in the position graph, represented by a dotted line, is referred to as 'jerk' and indicates a sudden change in velocity.
A positive slope in the position graph corresponds to a positive velocity.
The slope of the velocity vs. time graph represents acceleration.
Zero slope in the velocity graph indicates zero acceleration, as seen in the first section of the example.
The concept of 'jerk' is reintroduced as a sudden change in acceleration, which can be ignored for the purpose of graph matching.
The velocity graph shows a transition from negative to zero velocity, indicating the object is slowing down.
Positive acceleration is indicated by a positive slope in the acceleration vs. time graph.
An object is speeding up when acceleration (a) and velocity (v) are in the same direction, and slowing down when they are in opposite directions.
The direction of velocity and acceleration determines whether the object is speeding up or slowing down, not the sign (positive or negative) of the values.
The video provides a practical method for analyzing and predicting motion graphs based on changes in slope and direction.
The example demonstrates that an object can speed up or slow down while moving in a negative direction, challenging the common misconception that negative velocity means slow motion.
The process of matching motion graphs can be used to understand complex motion scenarios, such as an object coming to a stop and then reversing direction.
The video emphasizes the importance of understanding the relationship between velocity and acceleration in determining the state of motion.
The concept of 'frowny face graph' is introduced as a mnemonic for remembering when an object is speeding up or slowing down based on the direction of velocity and acceleration.
The video concludes by reinforcing the key points and encouraging viewers to apply this knowledge to understand various motion graphs.
Transcripts
Browse More Related Video
Position, Velocity, and Acceleration vs. Time Graphs
Position vs Time, Velocity vs Time & Acceleration vs Time Graph (Great Trick to Solve Every Graph!!)
Kinematics Graphs

Acceleration vs. time graphs | One-dimensional motion | Physics | Khan Academy
Visualizing Motion Using Tape Charts and Motion Graphs | SCIENCE 7 QUARTER 3 MODULE 2 WEEK 3
Motion Graphs - AP Physics 1: Kinematics Review Supplement
5.0 / 5 (0 votes)
Thanks for rating: