Position, Velocity, and Acceleration vs. Time Graphs
TLDRThe video script delves into the concept of acceleration, illustrating its relationship with position, velocity, and time through graphs. It clarifies that acceleration is the rate of change of velocity over time, measured in m/s^2, and is a vector quantity. The script explains how to interpret position vs. time, velocity vs. time, and acceleration vs. time graphs, highlighting how slopes and areas under the curves represent velocity and displacement. It emphasizes that while position vs. time shows velocity as slope, acceleration cannot be directly derived from it. The velocity vs. time graph reveals acceleration through its slope, and the acceleration vs. time graph, consisting of horizontal lines, shows constant acceleration. The script concludes with the importance of direction in determining whether an object is speeding up or slowing down.
Takeaways
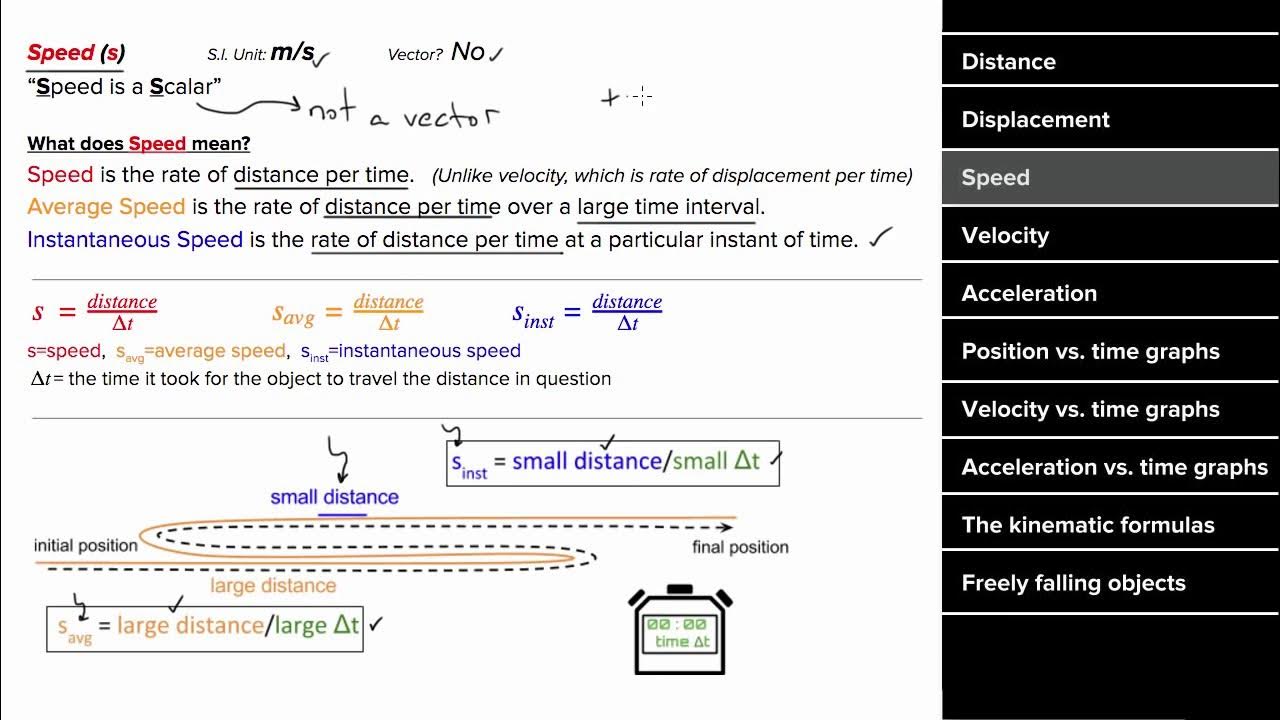
- 📚 Acceleration is the rate at which velocity changes over time, and it is represented in meters per second squared (m/s²).
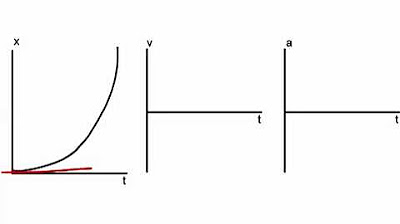
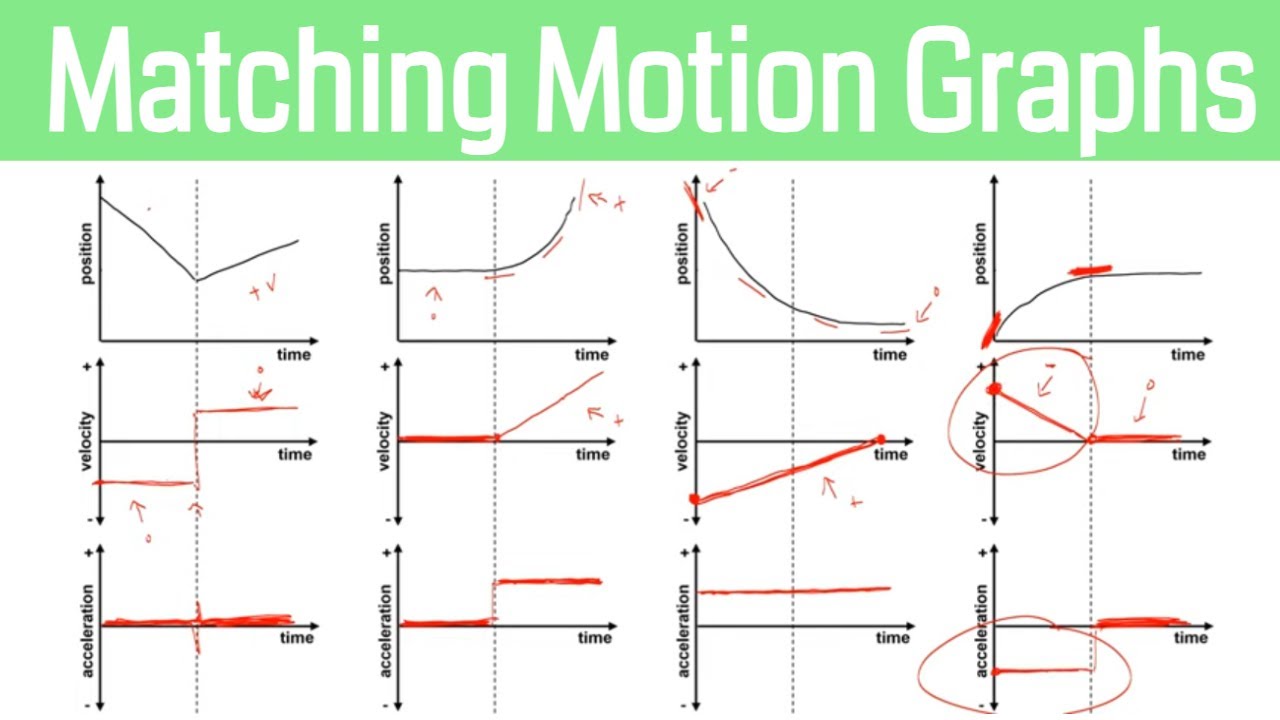
- 📈 The position vs. time graph shows displacement and velocity as the slope, but not acceleration directly.
- 🚀 A positive slope on a position vs. time graph indicates forward motion, while a negative slope indicates backward motion.
- 🔍 In a position vs. time graph, parabolic shapes suggest acceleration, curving towards horizontal lines for slowing down and towards vertical lines for speeding up.
- 📊 The velocity vs. time graph can show displacement through the area under the curve and velocity through interpolation.
- ↗️ A positive slope on a velocity vs. time graph indicates positive acceleration, while a negative slope indicates negative acceleration.
- 🔢 A horizontal line in a velocity vs. time graph signifies constant velocity, where the slope is zero.
- 🛑 A velocity vs. time graph above the x-axis represents forward motion, while below it indicates backward motion.
- 📉 The acceleration vs. time graph consists of horizontal lines, where the area under the graph can indicate changes in velocity.
- 🔄 Acceleration vs. time graphs cannot directly show displacement, but they can show the magnitude and direction of acceleration changes.
- 🔄.5 To determine if an object is speeding up or slowing down, and the direction of motion, one must consider the direction of both acceleration and velocity in relation to each other.
Q & A
What is the definition of acceleration?
-Acceleration is the rate at which velocity changes over time. It measures how quickly an object speeds up or slows down.
What is the unit of acceleration?
-The unit of acceleration is meters per second squared (m/s²), which is derived from the unit of velocity (m/s) over time (seconds).
How is acceleration represented on a position versus time graph?
-On a position versus time graph, acceleration cannot be directly derived as the graph shows position over time. However, the slope of the graph represents velocity, and changes in the slope indicate acceleration.
How can you determine displacement from a position versus time graph?
-Displacement can be determined by reading the graph at a specific time. For example, if you want to know the displacement at 4 seconds, you read the graph to find the corresponding position.
What does the slope of a velocity versus time graph represent?
-The slope of a velocity versus time graph represents acceleration, as it is the change in velocity (m/s) over time (seconds), which results in m/s².
How can you find the area under a velocity versus time graph?
-The area under a velocity versus time graph can be found using common shapes like rectangles and triangles. The area of a rectangle is length times width, and the area of a triangle is 1/2 base times height.
What does a horizontal line on a velocity versus time graph indicate?
-A horizontal line on a velocity versus time graph indicates a constant velocity, meaning the object is moving at the same speed without acceleration.
How can you determine if an object is moving forward or backward from a velocity versus time graph?
-An object is moving forward if its velocity is above the x-axis (positive velocity) and backward if its velocity is below the x-axis (negative velocity).
What does a positive acceleration on an acceleration versus time graph indicate?
-A positive acceleration on an acceleration versus time graph indicates that the object is speeding up in the direction that its velocity is pointing.
How can you find the velocity from an acceleration versus time graph?
-Velocity can be found by looking at the area underneath or above the graph relative to the x-axis. The graph itself shows the acceleration at different times.
What does a negative acceleration on an acceleration versus time graph indicate?
-A negative acceleration on an acceleration versus time graph indicates that the object is slowing down, which could also mean it's speeding up in the opposite direction if its velocity is negative.
Outlines
📈 Understanding Acceleration Through Graphs
This paragraph delves into the concept of acceleration, explaining it as the rate at which velocity changes over time. The unit of acceleration is m/s², derived from velocity. The discussion revolves around three types of graphs: position vs. time, velocity vs. time, and acceleration vs. time. The position vs. time graph illustrates displacement and velocity through the slope, but not acceleration. Velocity vs. time graphs show displacement as the area under the curve and velocity through interpolation. These graphs also indicate whether the object is speeding up or slowing down based on the direction of the curve. Acceleration, however, is best understood through its own graph, where it is represented by horizontal lines, each indicating a constant rate of change in velocity. The paragraph emphasizes the vector nature of acceleration and its directionality, which is crucial in determining whether an object is speeding up or slowing down.
📊 Analyzing Velocity and Acceleration Graphs
The second paragraph focuses on the velocity vs. time graph, detailing how to interpret different slopes to determine the acceleration: positive slopes indicate speeding up, negative slopes indicate slowing down, and zero slopes represent constant velocity. The graph's position relative to the x-axis signifies the direction of motion, with values above indicating forward motion and those below indicating backward motion. The paragraph also explains how to calculate displacement from the area under the velocity graph and how to find velocity through interpolation. It discusses the concept of a 'stoplight' graph, where the middle represents a stop (zero velocity), and movement away from the center signifies increasing velocity in either direction. The paragraph concludes by explaining that horizontal lines on the acceleration vs. time graph represent constant acceleration, and any change would be indicated by a sudden shift to a new horizontal line.
📚 Interpreting Acceleration vs. Time Graphs
The final paragraph discusses the acceleration vs. time graph, emphasizing that it consists of horizontal lines, each representing a constant acceleration. The paragraph explains that it's not possible to derive displacement from this graph but velocity can be found by looking at the area relative to the x-axis. The paragraph also touches on the difficulty of interpreting the direction of motion from the acceleration graph alone, as it only provides information about the magnitude and sign of acceleration. However, by knowing that positive acceleration occurs when both the direction of acceleration and velocity are the same, one can infer the motion's nature. The paragraph concludes by reiterating that changes in acceleration are represented by shifts between horizontal lines on the graph.
Mindmap
Keywords
💡Acceleration
💡Position vs. Time Graph
💡Velocity
💡Displacement
💡Slope
💡Interpolation
💡Velocity vs. Time Graph
💡Area Under the Curve
💡Constant Velocity
💡Acceleration vs. Time Graph
Highlights
Understanding acceleration requires analyzing its representation on position vs. time, velocity vs. time, and acceleration vs. time graphs.
Acceleration is the rate at which velocity changes over time, indicating how quickly an object speeds up or slows down.
The unit of acceleration is meters per second squared (m/s^2), derived from the velocity unit (m/s) over time (seconds).
Acceleration, like displacement and velocity, is a vector quantity with direction indicated by its sign.
Position vs. time graph plots position on the Y-axis and time on the X-axis, with velocity represented as the slope.
Displacement can be found through interpolation on a position vs. time graph, but acceleration cannot be directly derived.
A position vs. time graph's upward trend indicates forward movement, while a downward trend indicates backward movement.
Curves or parabolic shapes in position vs. time graphs represent acceleration towards or away from the velocity axis.
Velocity vs. time graph plots velocity on the Y-axis and time on the X-axis, with acceleration as the slope of the line.
Displacement on a velocity vs. time graph is represented by the area under the curve.
Interpolation on a velocity vs. time graph allows for finding velocity at specific time points.
A horizontal line on a velocity vs. time graph indicates constant velocity.
Graph shapes above the X-axis on a velocity vs. time graph indicate forward movement, while below indicates backward movement.
The Y-axis acts as a number line for velocity, with larger absolute values indicating faster velocities.
Acceleration vs. time graph plots acceleration on the Y-axis and time on the X-axis, with horizontal lines indicating constant acceleration.
Velocity can be found by the area relative to the X-axis on an acceleration vs. time graph.
In acceleration vs. time graphs, horizontal lines above or below the axis indicate the direction of acceleration relative to the velocity.
Vertical lines in acceleration vs. time graphs represent a quick shift in acceleration, indicating a change in the rate of velocity change.
Transcripts


5.0 / 5 (0 votes)
Thanks for rating: