Kinematics Graphs
TLDRThe video script from Mystery Science Theater explores kinematics graphs, focusing on how to interpret position, velocity, and acceleration over time. It explains that a linear position-time graph with constant velocity has a slope equal to velocity, while a curvy graph indicates changing velocity or acceleration. The script teaches how to find instantaneous velocity using tangent lines and how to derive velocity-time and acceleration-time graphs from position-time graphs. Examples illustrate how to determine the shape and slope of these graphs, revealing whether an object is speeding up, slowing down, or moving at a constant rate.
Takeaways
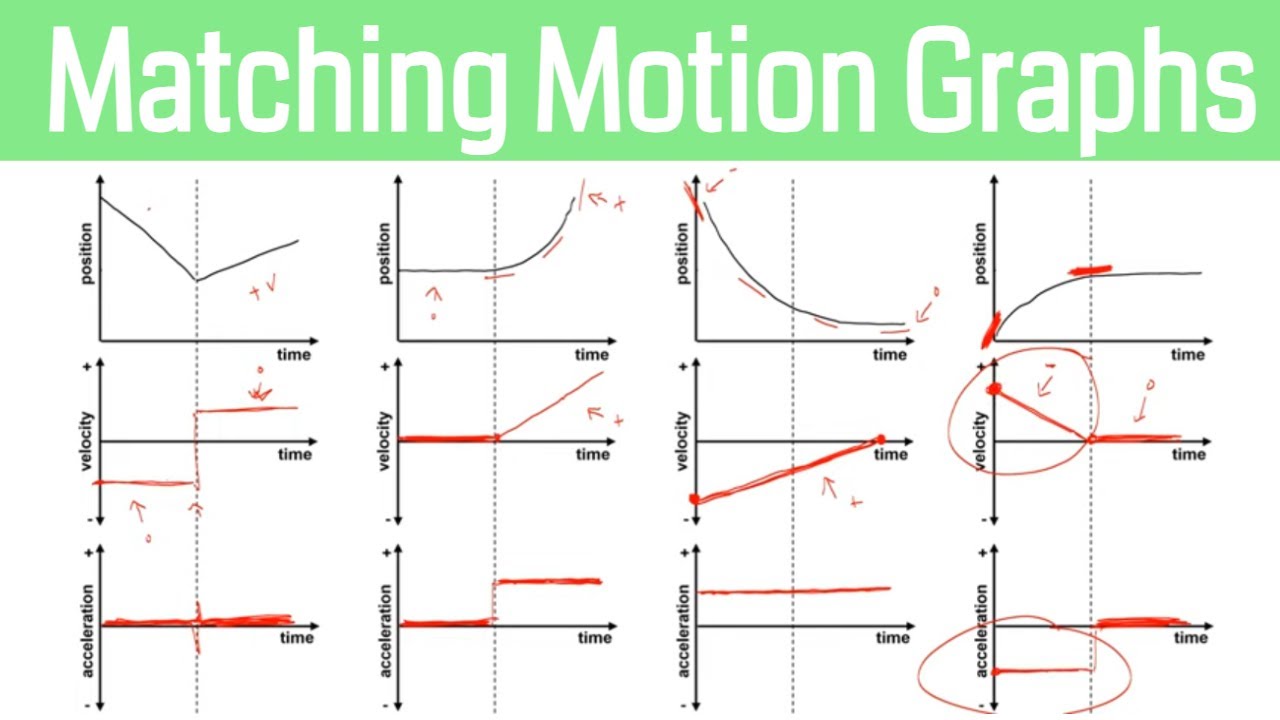
- 📊 Kinematics Graphs: The video discusses three types of kinematics graphs: position vs. time, velocity vs. time, and acceleration vs. time.
- 🚶 Constant Velocity: When velocity is constant, the position vs. time graph is linear, with the slope representing velocity and the intercept representing initial position.
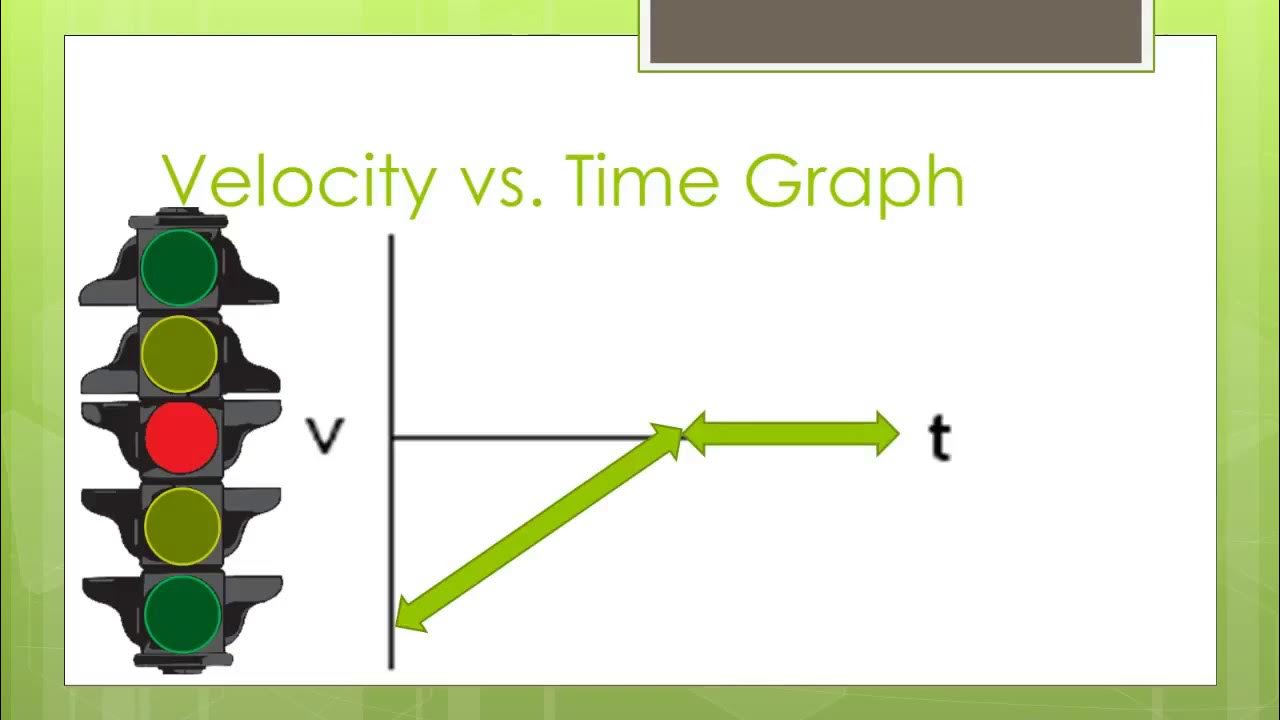
- 🔍 Velocity vs. Time: For constant velocity, the velocity vs. time graph is also linear, with a constant slope equal to the velocity.
- 🔄 Acceleration: Acceleration is the change in velocity over time, and it indicates when the velocity of an object is changing.
- 📉 Position vs. Time for Acceleration: In an accelerating scenario, the position vs. time graph is curvilinear, indicating a changing velocity (changing slope).
- 🔎 Instantaneous Velocity: To find how fast an object is moving at a specific instant, use the slope of the tangent line to the position vs. time graph at that point.
- 📈 Velocity vs. Time for Acceleration: The velocity vs. time graph starts at zero and increases linearly, indicating an object that begins from rest and accelerates at a constant rate.
- 📉 Acceleration vs. Time: The slope of the velocity vs. time graph represents acceleration, which is constant in the example given (a straight line with a constant slope).
- 🛑 Deceleration Example: The video provides an example where the velocity starts positive, decreases to zero, indicating deceleration, and the acceleration vs. time graph shows a constant negative acceleration.
- 🔀 Change in Direction: Another example shows a position vs. time graph with a change in direction, resulting in a velocity vs. time graph that crosses through zero and an acceleration that is positive then negative.
- 📚 Understanding Kinematics: The video aims to help viewers understand how to interpret and derive velocity and acceleration from position vs. time graphs.
Q & A
What is the significance of the slope in a position versus time graph for constant velocity?
-In a position versus time graph for constant velocity, the slope represents the velocity of the object. A linear graph indicates that the velocity is constant, and the slope's value is equal to the velocity.
How does the velocity versus time graph differ when the velocity is constant?
-When velocity is constant, the velocity versus time graph will also be a straight line. However, the slope of this line represents the constant velocity value, and the y-intercept is not relevant as it does not affect the velocity.
What does acceleration represent in the context of kinematics?
-Acceleration represents the rate of change of velocity. It is defined as the change in velocity divided by the time over which this change occurs.
How does the slope of a position versus time graph indicate if an object is accelerating?
-If the slope of a position versus time graph is changing, it indicates that the object's velocity is changing, which means the object is accelerating.
What is the difference between average velocity and instantaneous velocity?
-Average velocity is calculated by dividing the total displacement by the total time taken, whereas instantaneous velocity is the velocity of an object at a specific instant in time, which can be found by drawing a tangent line to the position versus time graph at that point.
How can you determine the instantaneous velocity from a position versus time graph?
-To determine the instantaneous velocity, you draw a tangent line to the position versus time graph at the point of interest. The slope of this tangent line represents the instantaneous velocity at that point in time.
What does the shape of a velocity versus time graph tell us about the object's acceleration?
-The slope of the velocity versus time graph indicates the acceleration of the object. A constant slope means the object has a constant acceleration, while a changing slope indicates variable acceleration.
If a position versus time graph starts with a positive slope and ends with a zero slope, what does this imply about the object's velocity and acceleration?
-If the position versus time graph starts with a positive slope and ends with a zero slope, it implies that the object starts with a positive velocity and slows down until its velocity reaches zero. This corresponds to a velocity versus time graph with a negative slope, indicating a constant negative acceleration.
What is the relationship between the slope of a velocity versus time graph and the acceleration?
-The slope of a velocity versus time graph directly represents the acceleration of the object. A positive slope indicates positive acceleration, a negative slope indicates negative acceleration, and a zero slope indicates no acceleration.
How can you predict the shape of the acceleration versus time graph based on the position versus time graph?
-The acceleration versus time graph can be predicted by analyzing the slope of the tangent lines on the position versus time graph. The changes in the slope of these tangent lines over time will give you the shape of the acceleration versus time graph.
What does it mean if the slope of a position versus time graph is close to zero at the beginning and becomes negative at the end?
-If the slope of a position versus time graph is close to zero at the beginning and becomes negative at the end, it means that the object's velocity starts at zero, increases negatively (indicating a change in direction or deceleration), and ends with a negative velocity. This corresponds to an acceleration versus time graph with a constant negative acceleration.
Outlines
📈 Understanding Kinematics Graphs
This paragraph introduces the concept of kinematics graphs, focusing on three main types: position versus time, velocity versus time, and acceleration versus time. It begins by explaining constant velocity and its representation on a position versus time graph, where the slope equals the velocity and the intercept represents the initial position. The paragraph then moves on to discuss acceleration, which indicates a change in velocity. The speaker uses examples to illustrate how to interpret position time graphs with changing slopes, which indicate changing velocities. The concept of instantaneous velocity is introduced as the velocity at a specific moment, found by drawing a tangent line to the position time graph at that point. The paragraph concludes with an example of a position time graph that starts with zero slope, indicating zero initial velocity, and then the slope increases, showing acceleration in the positive direction.
📊 Analyzing Velocity and Acceleration Graphs
The second paragraph delves deeper into the analysis of velocity and acceleration graphs. It starts by explaining that the slope of the velocity graph represents acceleration. Using the concept of a tangent line from the previous paragraph, the speaker describes how to interpret the velocity graph, which starts with zero velocity and increases positively, indicating constant acceleration. The paragraph provides examples of different position versus time graphs and how they translate into velocity and acceleration graphs. It discusses scenarios where the object starts with a positive velocity, slows down to zero, and then the acceleration graph shows a constant negative acceleration. Other examples include graphs where the velocity starts negative, goes to zero, and ends positive, indicating a positive constant acceleration. The paragraph also covers cases where the velocity starts negative and ends at zero, with a positive acceleration, and where the velocity starts at zero and ends negative, with a negative constant acceleration.
👋 Concluding the Exploration of Kinematics Graphs
In the final paragraph, the speaker wraps up the discussion on kinematics graphs, summarizing the process of transitioning from a position graph to a velocity graph and then to an acceleration graph. The speaker invites viewers to ask questions if they have any and thanks them for learning about kinematics graphs. This paragraph serves as a conclusion to the video script, offering a brief recap and an opportunity for further engagement.
Mindmap
Keywords
💡Kinematics Graphs
💡Constant Velocity
💡Slope
💡Acceleration
💡Position Time Graph
💡Velocity Time Graph
💡Instantaneous Velocity
💡Tangent Line
💡Displacement
💡Average Velocity
Highlights
Introduction to kinematics graphs and their importance in understanding motion.
Explanation of constant velocity and its representation as a linear graph in position versus time.
The slope of the position versus time graph equals the velocity of the object.
Interpretation of the intercept in position versus time graphs as the initial position.
Velocity versus time graph for constant velocity shows a constant slope.
Acceleration is defined as the change in velocity over time.
Position versus time graph for an accelerating object shows a curvy line indicating changing velocity.
Concept of average velocity and how it is calculated using displacement over time.
Instantaneous velocity is the velocity at a specific point in time, found using a tangent line.
Tangent line on a position versus time graph represents instantaneous velocity.
Velocity versus time graph for an object starting from rest and accelerating shows a linear increase.
Acceleration is the slope of the velocity versus time graph.
Example of how to interpret a position versus time graph to determine velocity and acceleration.
Demonstration of how a position graph with a positive slope indicates increasing velocity.
Explanation of how a velocity graph with a negative slope indicates deceleration.
Acceleration graph with a constant negative slope indicates constant deceleration.
Position graph with a negative slope at the beginning and zero at the end indicates velocity starting negative and ending at zero.
Final example showing a position graph with a slope close to zero increasing to a negative slope.
Summary of how to transition from a position graph to velocity and acceleration graphs.
Transcripts


5.0 / 5 (0 votes)
Thanks for rating: