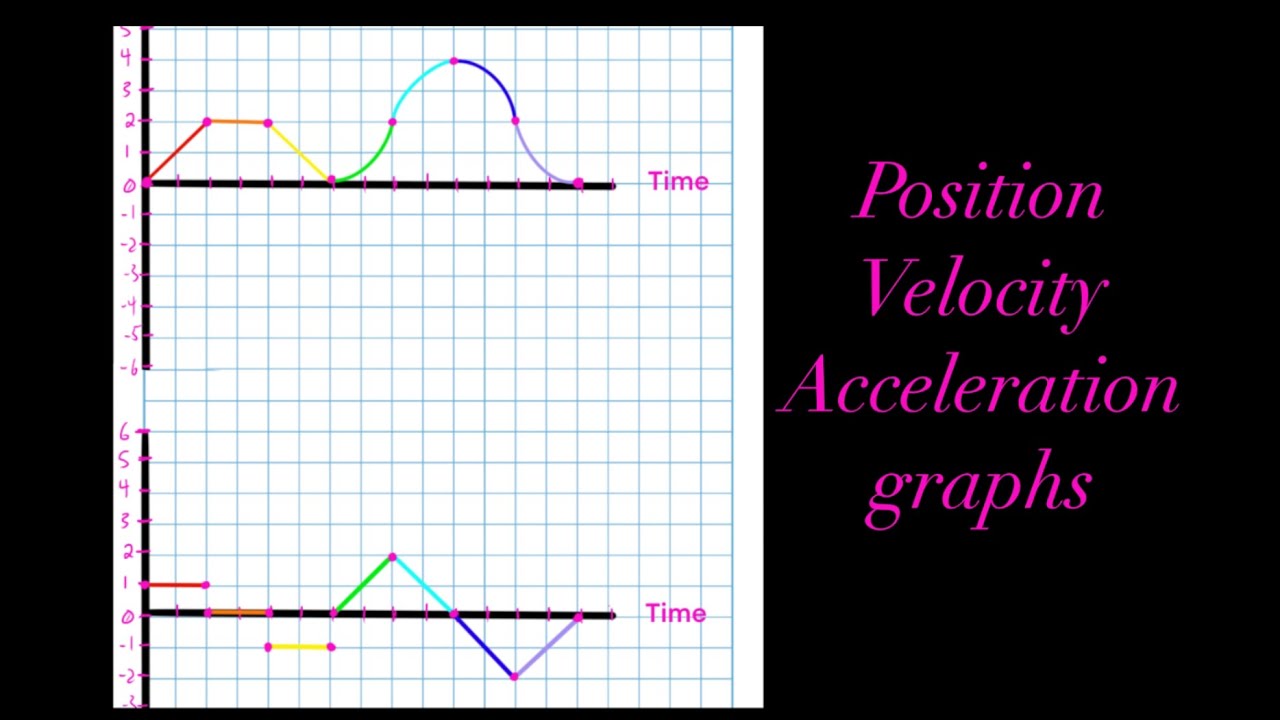
Motion Graphs: Transforming Position to Velocity to Acceleration vs Time
TLDRThis educational video script explains the process of converting position-time graphs to velocity-time and acceleration-time graphs. It emphasizes the importance of understanding the slope's meaning in these graphs, where the slope represents velocity in the position-time graph and acceleration in the velocity-time graph. The script provides a detailed walkthrough of different graph scenarios, including constant velocity and acceleration, as well as varying directions of motion, to help students grasp the concepts effectively.
Takeaways
- 📈 The slope of a position versus time graph represents velocity, indicating the speed and direction of an object's motion.
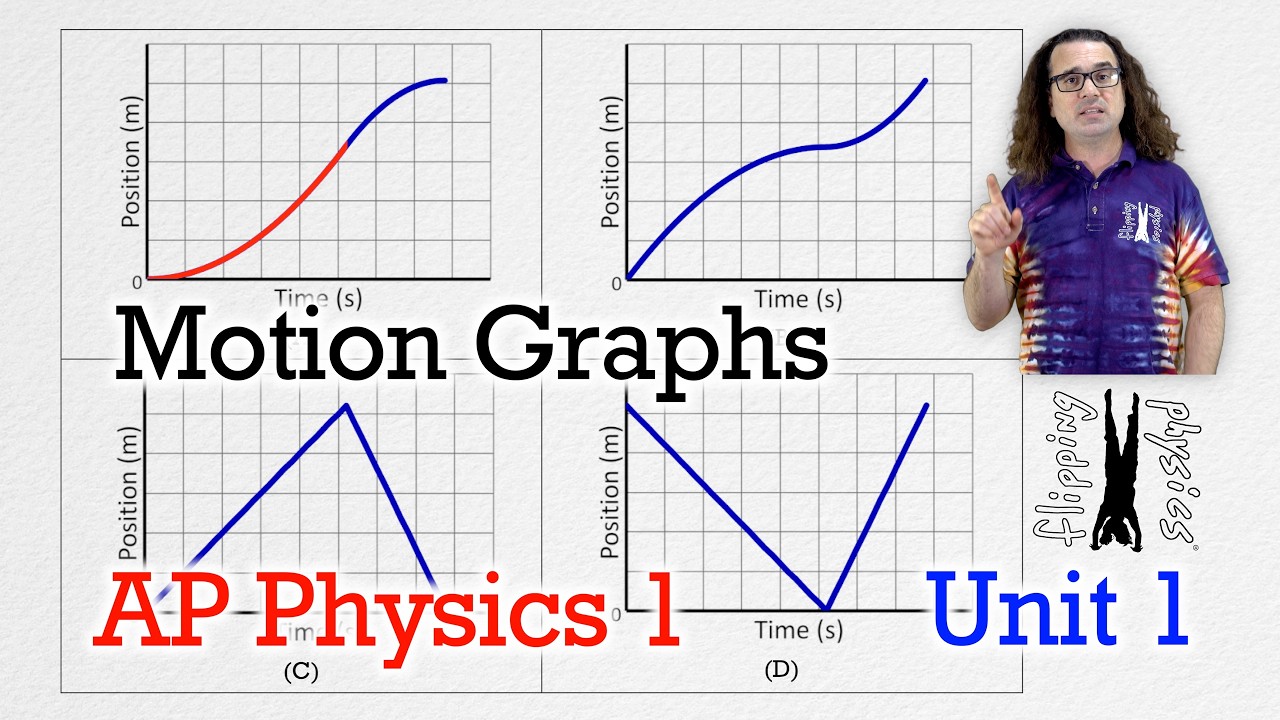
- 📊 A straight line on the position vs. time graph signifies constant velocity, with no acceleration.
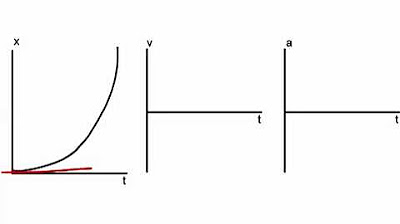
- 📈 A curved line on the position vs. time graph indicates changing velocity, which means the object is accelerating.
- 🚫 A horizontal line on the position vs. time graph (zero slope) corresponds to zero velocity and no motion.
- ⬆️ A positive slope on the position vs. time graph indicates motion in the positive direction with constant positive velocity.
- ⬇️ A negative slope on the position vs. time graph indicates motion in the negative direction with constant negative velocity.
- 🔄 The direction of motion is determined by the sign (positive or negative) of the velocity.
- 📊 On the velocity vs. time graph, a straight line represents constant acceleration, with the slope equal to the acceleration.
- 🔄 For a velocity vs. time graph, the direction (positive or negative) of the slope indicates the direction of acceleration or deceleration.
- 📈 A positive acceleration on the acceleration vs. time graph means the object is speeding up in the positive direction.
- 📉 A negative acceleration on the acceleration vs. time graph means the object is slowing down or speeding up in the negative direction.
Q & A
What is the relationship between the slope of a position-time graph and velocity?
-The slope of a position-time graph is always equal to the velocity of the object being described. A constant slope indicates a constant velocity, while a changing slope indicates a change in velocity, which means the object is accelerating.
How does the sine of velocity relate to the direction of motion?
-The sine of velocity indicates the direction of motion. A positive sine value corresponds to motion in the positive direction, while a negative sine value corresponds to motion in the negative direction.
What does a straight line on a position-time graph represent?
-A straight line on a position-time graph represents constant velocity, meaning there is no acceleration. Whether the line is horizontal (zero slope) or has a positive or negative slope, it indicates uniform motion in the respective direction.
How can you determine if an object is accelerating or decelerating from a position-time graph?
-If the slope of the line (or the curve) on a position-time graph is changing, the object is accelerating or decelerating. An increasing slope indicates speeding up (accelerating), while a decreasing slope indicates slowing down (decelerating).
What is the typical representation of a velocity-time graph in high school or early university physics?
-In high school or early university physics, a velocity-time graph is typically represented by a straight line. The slope of this line represents the acceleration of the object.
How does the slope of the velocity-time graph relate to acceleration?
-The slope of the velocity-time graph is equal to the acceleration of the object. A positive slope indicates positive acceleration (speeding up), while a negative slope indicates negative acceleration (slowing down).
What does a curved line on a position-time graph indicate?
-A curved line on a position-time graph indicates that the object is accelerating because the slope (which represents velocity) is changing.
How can you determine the direction of acceleration from a position-time graph?
-The direction of acceleration can be determined by the tangent to the curve on the position-time graph. The slope of the tangent line at any point gives the instantaneous acceleration, and its sign (positive or negative) indicates the direction of acceleration.
What are the two key concepts to remember when analyzing a position-time graph?
-The two key concepts are: 1) The slope of the line (or curve) represents velocity, and 2) The direction of the slope (positive or negative) represents the direction of motion.
How does the shape of the velocity graph relate to the object's motion?
-The shape of the velocity graph reflects the object's motion. A horizontal line indicates constant velocity, while a line sloping upwards indicates speeding up (positive acceleration), and a line sloping downwards indicates slowing down (negative acceleration).
What are the three types of motion represented by straight lines on a position-time graph?
-The three types of motion represented by straight lines on a position-time graph are: 1) Rest (zero slope, zero velocity), 2) Uniform motion in a positive direction (positive slope), and 3) Uniform motion in a negative direction (negative slope).
Outlines
📈 Introduction to Graph Transformations
The video begins with an introduction to transforming position-time graphs to velocity-time and acceleration-time graphs. The speaker emphasizes the importance of understanding the basic concepts, such as the slope of the position-time graph representing velocity and the sign of the velocity indicating direction. The speaker also encourages viewers to subscribe to the channel and utilize additional teaching materials available on their website. The video aims to clarify common misconceptions about velocity and direction, and sets the stage for a detailed explanation of graph analysis.
🏃♂️ Analyzing Position and Velocity Graphs
This paragraph focuses on analyzing the position versus time graph and the velocity versus time graph. The speaker explains that a straight line on the position graph indicates constant velocity and no acceleration, while a curved line indicates changing velocity and acceleration. The video provides examples of horizontal and inclined straight lines, illustrating zero and positive constant velocities, respectively. The speaker also discusses how to interpret the slope of these lines in terms of velocity and acceleration, emphasizing the relationship between the slope of the position graph and velocity, and the slope of the velocity graph and acceleration.
🚀 Understanding Acceleration in Graphs
The speaker delves into the concept of acceleration as depicted in graphs. Using a variety of examples, the speaker explains how to determine if an object is speeding up or slowing down by analyzing the curvature and slope of the lines on the position and velocity graphs. The explanation includes how to draw tangent lines to determine the direction and nature of the acceleration. The speaker also clarifies the difference between positive and negative velocities and accelerations, and how they relate to the direction of motion. The goal is to provide a comprehensive understanding of how to interpret and analyze the dynamics of motion through graph analysis.
🙏 Conclusion and Call to Action
In the concluding paragraph, the speaker wraps up the discussion on graph transformations and analysis. They reiterate the importance of understanding the relationship between position, velocity, and acceleration graphs. The speaker thanks the viewers for their attention and engagement, and encourages them to support the channel by subscribing, turning on notifications, liking the video, commenting, and sharing the content. The speaker also reminds viewers of the additional resources available on their website and expresses anticipation for the next video in the series.
Mindmap
Keywords
💡position versus time graph
💡velocity versus time graph
💡acceleration
💡slope
💡constant velocity
💡direction of motion
💡tangent line
💡deceleration
💡positive acceleration
💡negative acceleration
Highlights
The video explains the process of transforming position-time graphs to velocity-time and then to acceleration-time graphs.
The slope of the line on a position-time graph represents velocity.
The sign of the slope (positive or negative) indicates the direction of motion.
A straight line on the position-time graph signifies constant velocity and no acceleration.
A curved line on the position-time graph indicates changing velocity and acceleration.
The velocity-time graph typically features a straight line, not a curve.
The slope of the line on the velocity-time graph equals acceleration.
A horizontal line on the position-time graph means zero velocity and zero acceleration.
A line with a positive slope on the position-time graph indicates positive constant velocity and direction.
A line with a negative slope on the position-time graph indicates negative constant velocity and direction.
A curve with increasing slope on the position-time graph indicates speeding up.
A curve with decreasing slope on the position-time graph indicates slowing down.
The direction of acceleration is determined by the sign of the slope of the tangent line to the curve on the position-time graph.
The acceleration-time graph always features horizontal lines, indicating constant acceleration.
The sign of the slope on the acceleration-time graph indicates the direction of the acceleration.
The video emphasizes the importance of understanding the relationship between position, velocity, and acceleration graphs.
Transcripts
Browse More Related Video

Velocity Time Graphs, Acceleration & Position Time Graphs - Physics
Motion Graphs - AP Physics 1: Kinematics Review Supplement

High School Physics: Graphing Motion
Position vs Time, Velocity vs Time & Acceleration vs Time Graph (Great Trick to Solve Every Graph!!)
Visualizing Motion Using Tape Charts and Motion Graphs | SCIENCE 7 QUARTER 3 MODULE 2 WEEK 3
Kinematics Graphs
5.0 / 5 (0 votes)
Thanks for rating: