Ch. 3.7 Polynomial and Rational Inequalities
TLDRThis video script covers the topic of polynomial and rational inequalities, drawing connections to previous chapters on inequality graphing and function analysis. The instructor outlines a methodical approach to solving these inequalities, emphasizing zeroing out the inequality, simplifying, factoring, and identifying zeros and vertical asymptotes. Examples illustrate solving when one polynomial is less than another and comparing rational functions. The script concludes with graphing techniques and sign analysis to determine intervals where inequalities hold, providing a comprehensive guide to this mathematical subject.
Takeaways
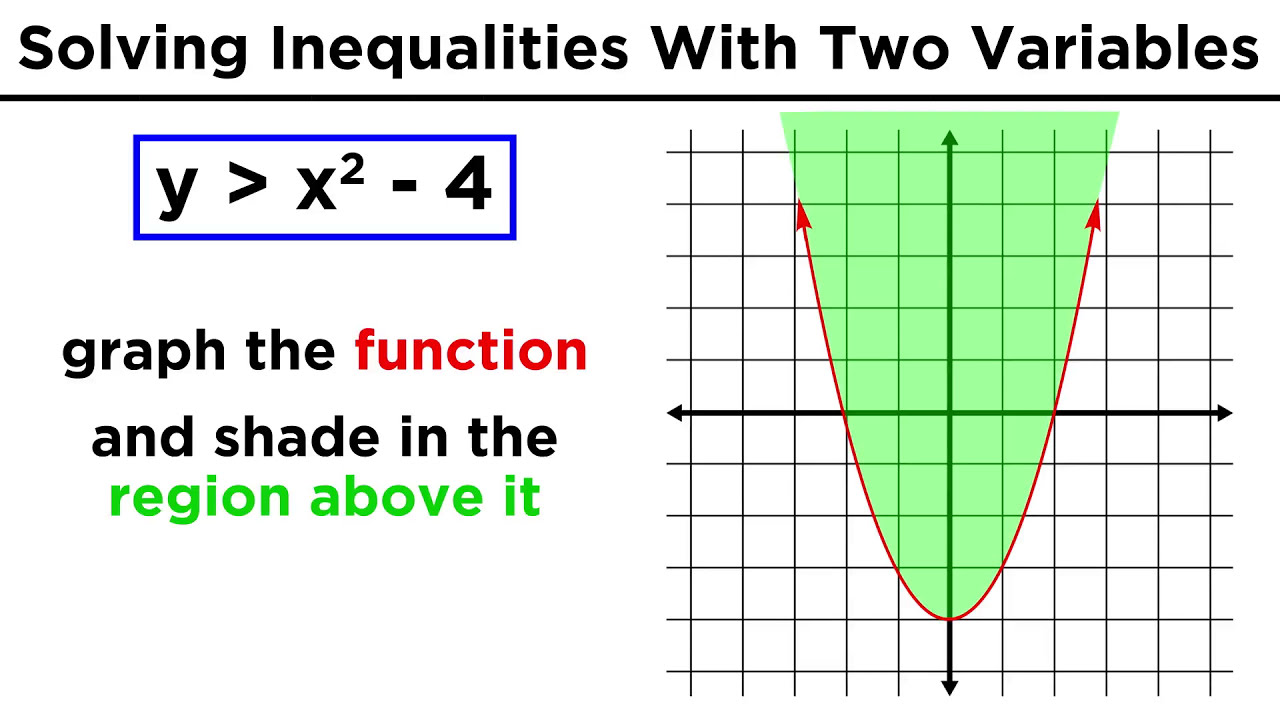
- 📚 The lecture covers polynomial and rational inequalities, linking back to previous sections on inequalities and function graphs.
- 🔍 The process involves zeroing out the inequality, simplifying, factoring, identifying zeros and vertical asymptotes, and determining the sign of the function between these points.
- 📉 To solve inequalities, compare functions to each other, such as when one polynomial is greater than another or a polynomial is greater than a rational function.
- 📝 The first example demonstrates solving when a fourth-degree polynomial is less than or equal to another fourth-degree polynomial, using synthetic division to find zeros and factoring by grouping.
- 📈 The zeros and intervals where the polynomial is less than or equal to zero are identified, leading to a closed interval solution.
- 📊 The graph of the polynomial is discussed, including its behavior, zeros, and y-intercept, with an emphasis on the importance of understanding the function's analytical properties for graphing.
- 📌 The second example involves solving a rational function inequality, emphasizing the importance of making a common denominator without clearing fractions to avoid incorrect solutions.
- 📐 After simplifying the rational inequality, zeros and vertical asymptotes are identified, and the sign of the function is determined between these points to find where the inequality holds true.
- 📘 The solution to the rational inequality is given as intervals where the function is positive, including the behavior at infinity and around vertical asymptotes.
- 📚 The importance of understanding the end behavior of rational functions and how it affects the graph is highlighted, with the function approaching zero at positive and negative infinity.
- 🖋️ The final graph of the rational inequality includes zeros, vertical asymptotes, and horizontal asymptotes, with the function's sign between these points determining the solution intervals.
Q & A
What is the main topic of the last section in Chapter 3 of the transcript?
-The main topic is polynomial and rational inequalities, focusing on how to solve and graph them by comparing polynomials to each other or to rational functions.
What previous chapters are referenced in the transcript for their relevance to the topic of inequalities?
-Chapters 1.8 and 2.3 are referenced as they deal with inequalities and the graphing of functions, respectively.
What are the general steps for solving inequalities as mentioned in the transcript?
-The steps include zeroing out the inequality, simplifying as much as possible, factoring everything after zeroing it out, identifying zeros and vertical asymptotes, and determining if the function is positive or negative between these points.
How does the process of solving polynomial inequalities differ from solving rational inequalities?
-While the process is similar, the difference lies in that with rational inequalities, you do not clear the fractions but rather make a common denominator, and you must consider the implications of the square property of x which can lead to two different values of x.
What is the purpose of finding zeros and vertical asymptotes in the context of inequalities?
-Zeros and vertical asymptotes help in determining the intervals where the function is positive or negative, which is essential for solving inequalities and understanding the function's behavior.
Can you explain the sign-checking process used in the transcript to determine the intervals of the function's behavior?
-Sign-checking involves plugging in test points between zeros and vertical asymptotes to determine the sign of the function in those intervals, which helps in identifying where the inequality holds true.
What is the significance of the multiplicities of zeros in the context of graphing polynomials?
-Multiplicity indicates how many times a zero occurs and affects how the graph of the polynomial behaves at those points, such as crossing or bouncing off the x-axis.
How does the end behavior of a polynomial function influence its graph?
-The end behavior, determined by the sign and power of the leading coefficient, influences whether the graph of the polynomial will rise or fall as x approaches infinity or negative infinity.
What is the role of the common denominator in solving rational inequalities?
-The common denominator is used to combine the terms of the rational inequality into a single rational expression, which simplifies the process of analyzing and solving the inequality.
How does the transcript demonstrate the process of solving a rational inequality involving two functions?
-The transcript demonstrates by zeroing out the inequality, making a common denominator, simplifying, finding zeros and vertical asymptotes, and analyzing the sign of the resulting expression to determine where the inequality holds.
What is the graphical representation of the solution to a polynomial inequality as described in the transcript?
-The graphical representation involves plotting the zeros, identifying the intervals between zeros and vertical asymptotes where the inequality holds, and showing the end behavior of the polynomial to sketch the graph of the solution.
Outlines
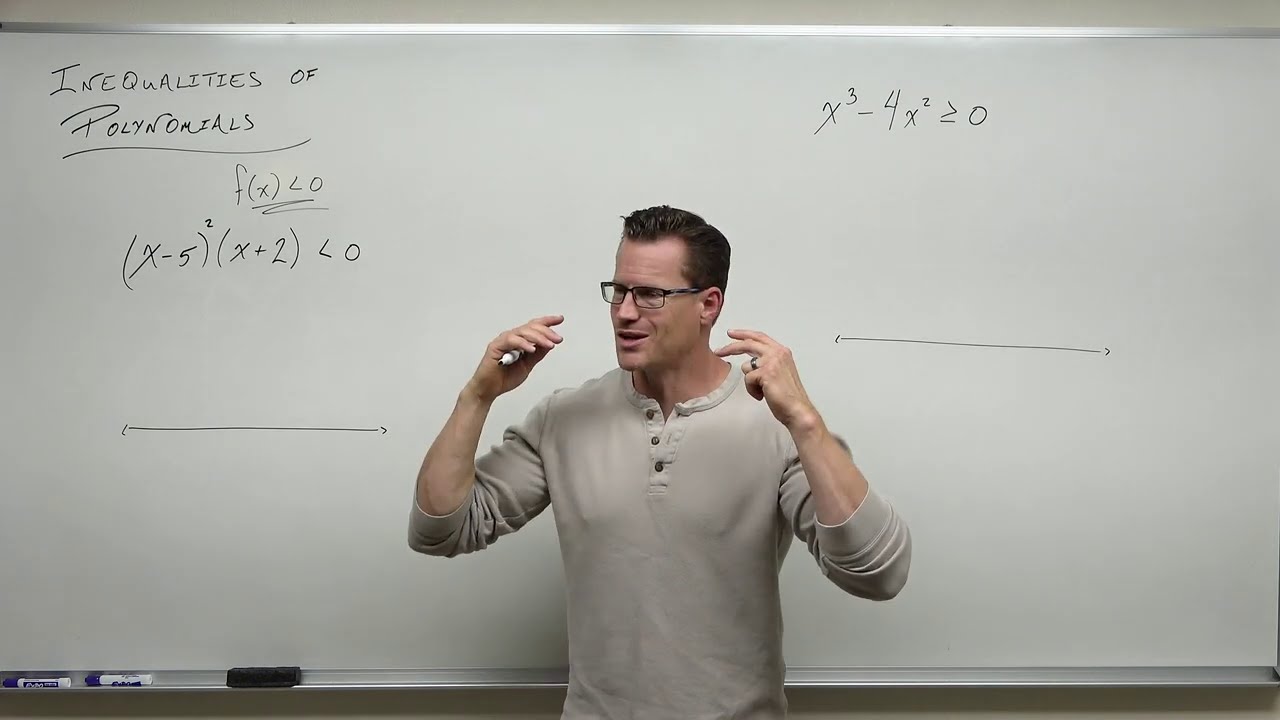
📚 Introduction to Polynomial and Rational Inequalities
This paragraph introduces the topic of polynomial and rational inequalities, setting the stage for a deeper dive into the subject. The instructor connects this section to previous chapters, emphasizing the importance of understanding inequalities and their graphical representation. The main goal is to compare polynomials and rational functions, using the knowledge of functions and their graphs to analyze these comparisons. The process involves zeroing out the inequality, simplifying, factoring, identifying zeros and vertical asymptotes, and determining the sign of the function between these points.
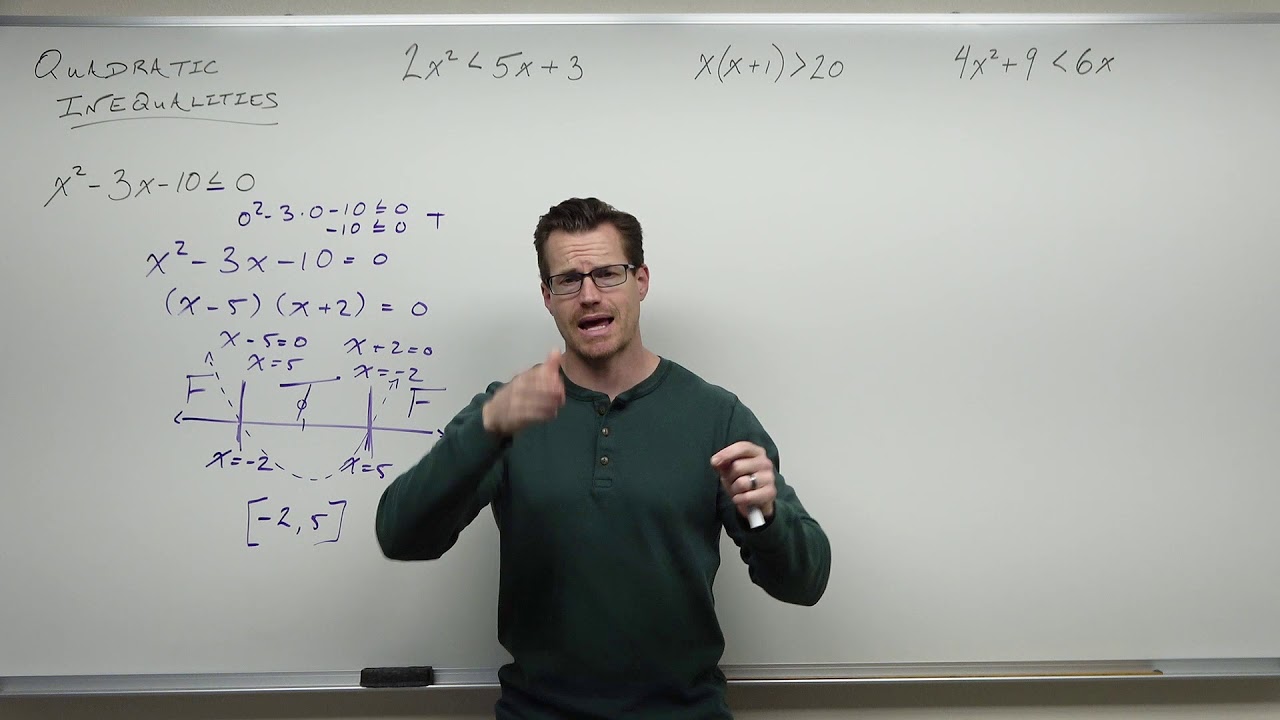
🔍 Solving a Fourth Degree Polynomial Inequality
The instructor provides a step-by-step walkthrough of solving a fourth degree polynomial inequality. The process begins with zeroing out the inequality by moving all terms to one side, aiming to simplify and factor the resulting expression. Synthetic division is used to find the zeros of the polynomial, and the instructor demonstrates solving by grouping to factor the polynomial further. The zeros are identified, and the sign of the polynomial is analyzed between these zeros and the vertical asymptotes. The solution involves determining the intervals where the polynomial is less than or equal to zero, leading to the conclusion of the interval from negative one to one half.
📈 Graphing Polynomial Inequalities
In this section, the focus shifts to graphing the results of polynomial inequalities. The instructor explains how to graph a polynomial function, considering its zeros, y-intercept, and end behavior. The graph is expected to be U-shaped due to the positive lead coefficient of the polynomial. The zeros and the behavior of the graph at the x-axis are used to sketch the graph of the polynomial. The instructor also discusses the importance of graphing two functions to find the points of intersection, which are crucial for understanding where one function is less than the other.
📘 Analyzing Rational Function Inequalities
The paragraph delves into solving inequalities involving rational functions. The process starts with zeroing out the inequality by moving terms to one side, but unlike polynomials, the fractions are not cleared due to potential complications with the square property of 'x'. Instead, a common denominator is created to simplify the expression. The instructor demonstrates combining like terms and finding the zeros and vertical asymptotes of the rational function. The sign of the function is analyzed between the zeros and asymptotes to determine where the function is positive, which is key to solving the inequality.
📊 Graphing Rational Inequality Solutions
The final paragraph wraps up with a discussion on graphing the solutions of rational inequalities. The instructor outlines the process of identifying zeros and vertical asymptotes and uses this information to sketch the graph of the rational function. The behavior of the function as it approaches positive and negative infinity is considered, along with the limits around the vertical asymptotes. The instructor emphasizes the importance of understanding the function's behavior between the asymptotes and zeros to accurately graph the solution to the inequality.
Mindmap
Keywords
💡Polynomial Inequalities
💡Rational Inequalities
💡Zeroing Out
💡Factoring
💡Zeros
💡Vertical Asymptotes
💡Sign Analysis
💡Solving Inequalities
💡Graphing Inequalities
💡Multiplicity
💡End Behavior
Highlights
Introduction to the last section in Chapter 3 focusing on polynomial and rational inequalities.
Linking back to previous sections on inequalities and graphing from Chapters 1.8 and 2.3.
Combining understanding of polynomials and rational functions to compare them in inequalities.
General steps for solving inequalities: zeroing out, simplifying, factoring, and identifying zeros and vertical asymptotes.
Determining the sign of the function between zeros and vertical asymptotes.
Solving when one polynomial is larger than another using a fourth-degree polynomial example.
Zeroing out and simplifying the inequality by moving terms to one side.
Identifying possible zeros and using synthetic division to find actual zeros.
Using the result of synthetic division to factor the polynomial by grouping.
Analyzing the polynomial less than or equal to zero to find intervals of satisfaction.
Checking values between zeros to determine the sign of the polynomial.
Graphing the polynomial and identifying intervals where the inequality holds true.
Differentiating between the exact graph and a quick hand-drawn approximation for practical purposes.
Demonstrating the process of graphing two functions to find where one is less than the other.
Solving a rational function inequality by zeroing out and making a common denominator.
Simplifying the rational inequality and combining like terms.
Analyzing the simplified rational function to find zeros and vertical asymptotes.
Conducting a sign check to determine when the rational function is positive.
Describing the end behavior of the rational function and its horizontal asymptotes.
Graphing the rational inequality using zeros, vertical asymptotes, and sign analysis.
Conclusion summarizing the process and the importance of understanding the behavior of functions in inequalities.
Transcripts
Browse More Related Video
Solving and Graphing Polynomial and Rational Inequalities
Ch. 1.8 Inequalities
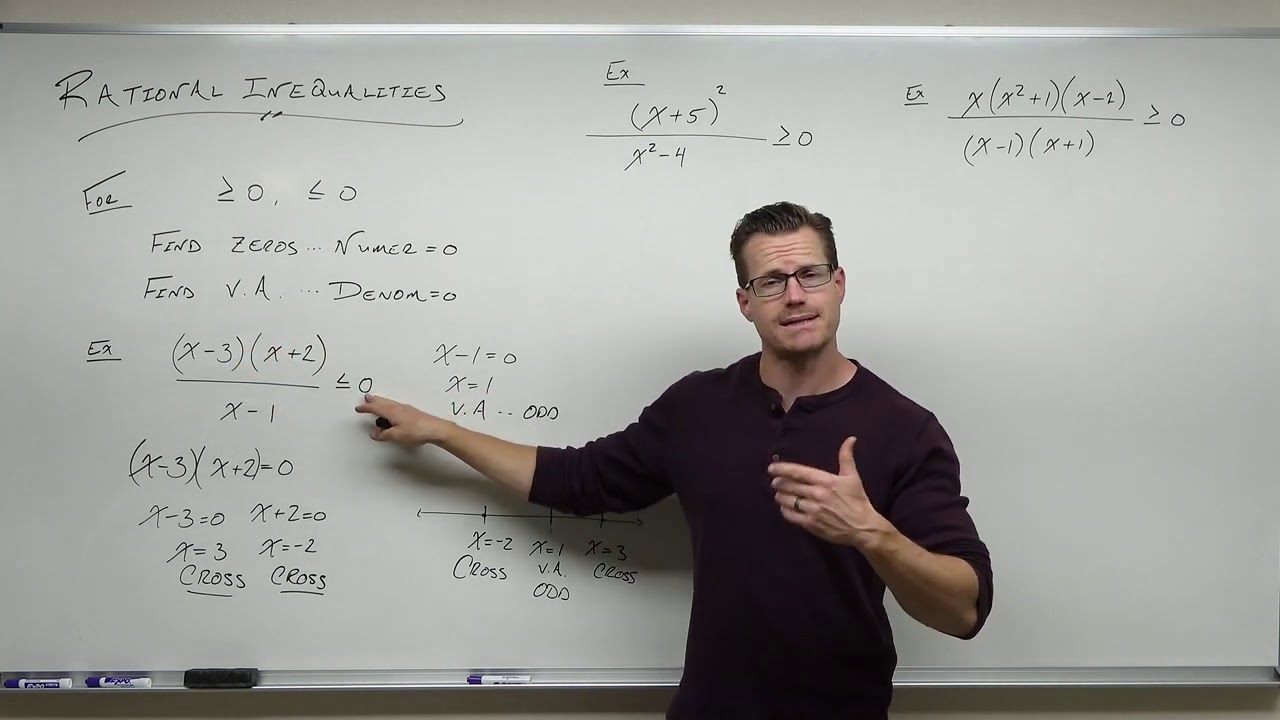
Inequalities with Rational Functions (Precalculus - College Algebra 47)
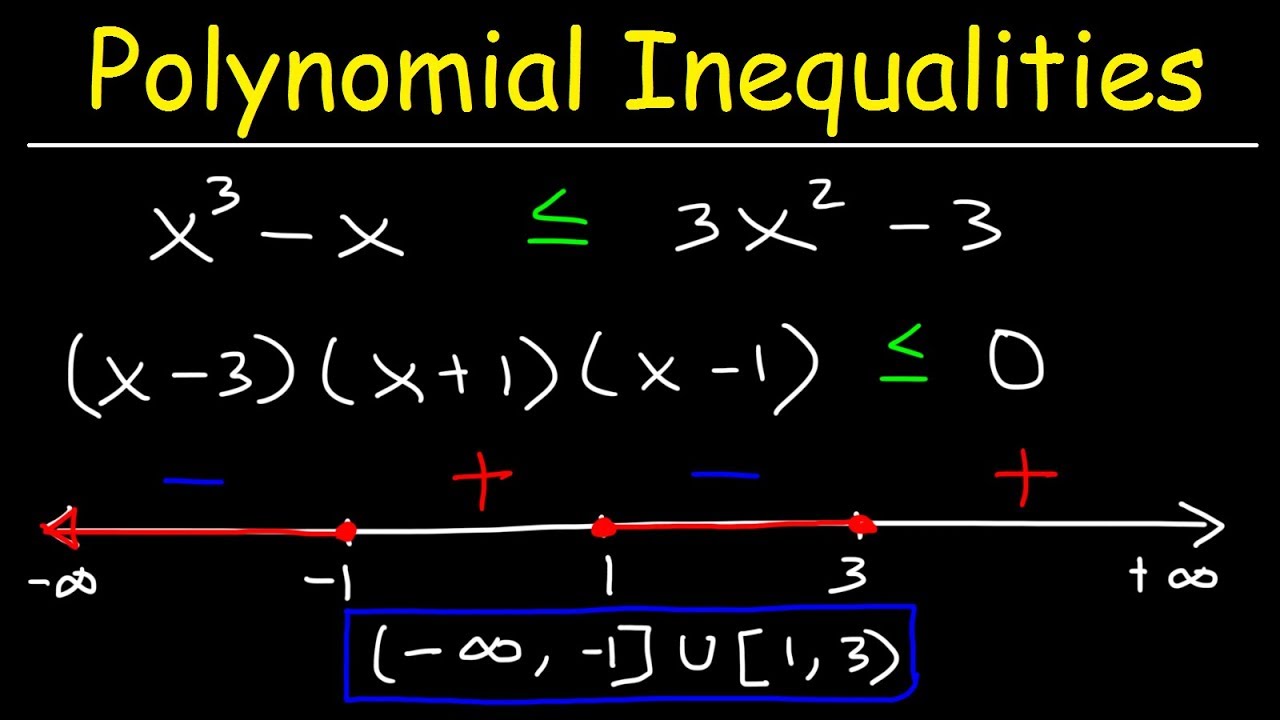
Solving Polynomial Inequalities
Inequalities with Polynomial Functions (Precalculus - College Algebra 46)
Solving Quadratic Inequalities (Precalculus - College Algebra 25)
5.0 / 5 (0 votes)
Thanks for rating: