Inequalities with Polynomial Functions (Precalculus - College Algebra 46)
TLDRThe video script presents a comprehensive exploration of inequalities in relation to polynomials, emphasizing the importance of understanding the graphical representation of functions and their behavior in relation to the x-axis. The presenter introduces two primary methods for addressing inequalities: a graphical approach, which involves identifying x-intercepts and determining whether they represent a 'bounce' or 'cross' to ascertain the intervals where the function is less than zero; and a plugging-in values approach, which tests the truth of the inequality by substituting easy-to-compute values. The script also highlights the significance of polynomial end behavior and multiplicity in determining the intervals of true and false for inequalities. The presenter encourages viewers to practice these concepts, as they are foundational for understanding more complex inequalities involving rational functions, which will be the focus of the subsequent video.
Takeaways
- 📈 Understanding inequalities involves visualizing them graphically, which is essential for grasping the concept of a function being less than, greater than, or equal to zero.
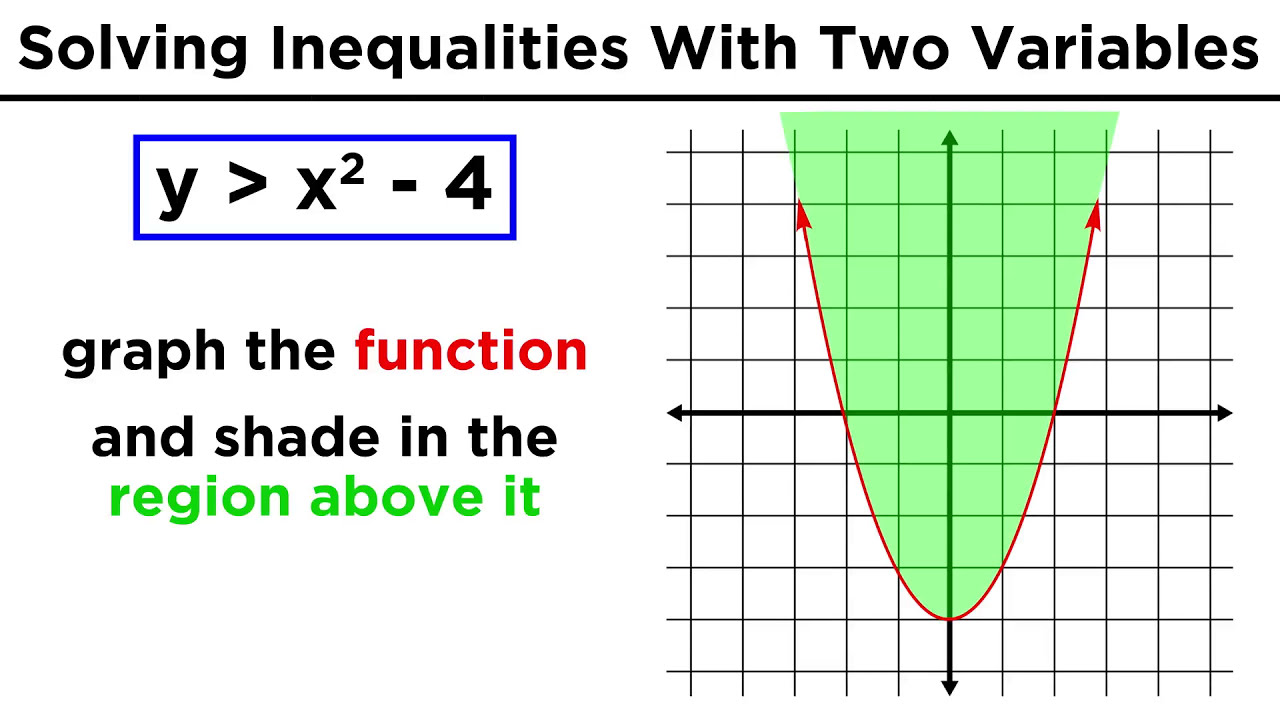
- 🤔 The first approach to solving inequalities involves graphing the function and identifying where it is less than zero, which corresponds to the graph being below the x-axis.
- 📌 X-intercepts are crucial in determining the intervals where the function changes its behavior from above to below the x-axis, or vice versa.
- 🔢 Factoring polynomials helps in identifying x-intercepts and understanding the nature of the roots (crossings or bounces), which is vital for graphing and solving inequalities.
- 📉 For polynomial functions, the end behavior is determined by the leading term, which dictates whether the graph will rise or fall to positive or negative infinity.
- 🔁 The concept of 'bouncing' at an x-intercept means the function maintains the same sign on either side of the bounce, whereas a 'crossing' changes the sign.
- 📋 A second method for solving inequalities is by plugging in values to test the truth of the inequality without graphing, which can be quicker but requires careful consideration of the intervals.
- ✅ Testing values can be simplified by choosing the easiest number to compute, often zero or a number close to zero, and deducing the truth value from there.
- 🔍 It's important to remember that with quadratic and higher degree polynomials, the truth value can alternate between true and false across different intervals due to the nature of the graph's behavior.
- ➡️ When translating between different forms of an inequality (e.g., from greater than to greater than or equal to), the solution set remains the same, just the question's perspective changes.
- ✍️ Practice is key, so after understanding the concepts, it's recommended to pause the video and attempt the examples independently to solidify the knowledge.
Q & A
What is the primary focus of the video?
-The video focuses on understanding inequalities in relation to polynomials, specifically how to determine where a polynomial function is less than, greater than, or equal to zero.
What is the importance of watching the last video before this one?
-The last video provided a graphical perspective on inequalities, which is essential for understanding the concepts of functions being less than or greater than zero and identifying intervals on the x-axis.
What are the two approaches the video mentions for dealing with inequalities?
-The video discusses a graphical approach, where you visualize the function and its relationship to the x-axis, and a plug-in approach, where you test values to see if they satisfy the inequality.
Why are x-intercepts important when dealing with polynomial inequalities?
-X-intercepts are important because they represent the points where the graph of the polynomial crosses or touches the x-axis, which can help determine the intervals where the polynomial function is positive, negative, or zero.
What does the video suggest for a quick way to test the truth of an inequality without graphing?
-The video suggests plugging in easy-to-compute values, such as zero or a number close to zero, to test the truth of the inequality across different intervals defined by the x-intercepts.
How does the video explain the concept of 'bouncing' and 'crossing' in the context of x-intercepts?
-The video explains that 'bouncing' occurs when a polynomial touches the x-axis and the sign of the output does not change, while 'crossing' happens when the polynomial crosses the x-axis and the sign of the output changes.
What is the significance of the end behavior of a polynomial when graphing inequalities?
-The end behavior of a polynomial determines the general shape of the graph as it approaches positive or negative infinity, which helps in sketching the graph and identifying the intervals of interest for the inequality.
How does the video approach the problem of finding where a cubic function is greater than a linear function?
-The video suggests translating the problem into a simpler form by manipulating the inequality to isolate the cubic function on one side and zero on the other, then factoring and finding the x-intercepts to determine the intervals.
What is the purpose of including x-intercepts in the solution set when dealing with inequalities of the form 'greater than or equal to'?
-X-intercepts are included in the solution set for 'greater than or equal to' inequalities because they represent points where the function value is exactly zero, which satisfies the condition of being greater than or equal to zero.
How does the video help students avoid common mistakes when solving inequalities?
-The video emphasizes the importance of understanding the behavior of polynomials at x-intercepts, the concept of bouncing versus crossing, and the use of interval notation. It also encourages students to check their work by verifying the truth values across different intervals.
What is the main takeaway from the video for students studying inequalities?
-The main takeaway is the importance of understanding the graphical representation of polynomial functions in relation to the x-axis and how this understanding can be applied to solve inequalities both graphically and algebraically.
Outlines
📈 Understanding Inequalities and Polynomials
This paragraph introduces the topic of inequalities in relation to polynomials. It emphasizes the importance of understanding the graphical representation of inequalities, specifically when a function's value is less than or greater than zero. The speaker outlines two approaches: a graphical method, which involves plotting the function and identifying intervals on the x-axis, and a direct method, which involves plugging in values to test the inequality. The paragraph also discusses the concept of x-intercepts and their role in determining where a polynomial function is less than zero.
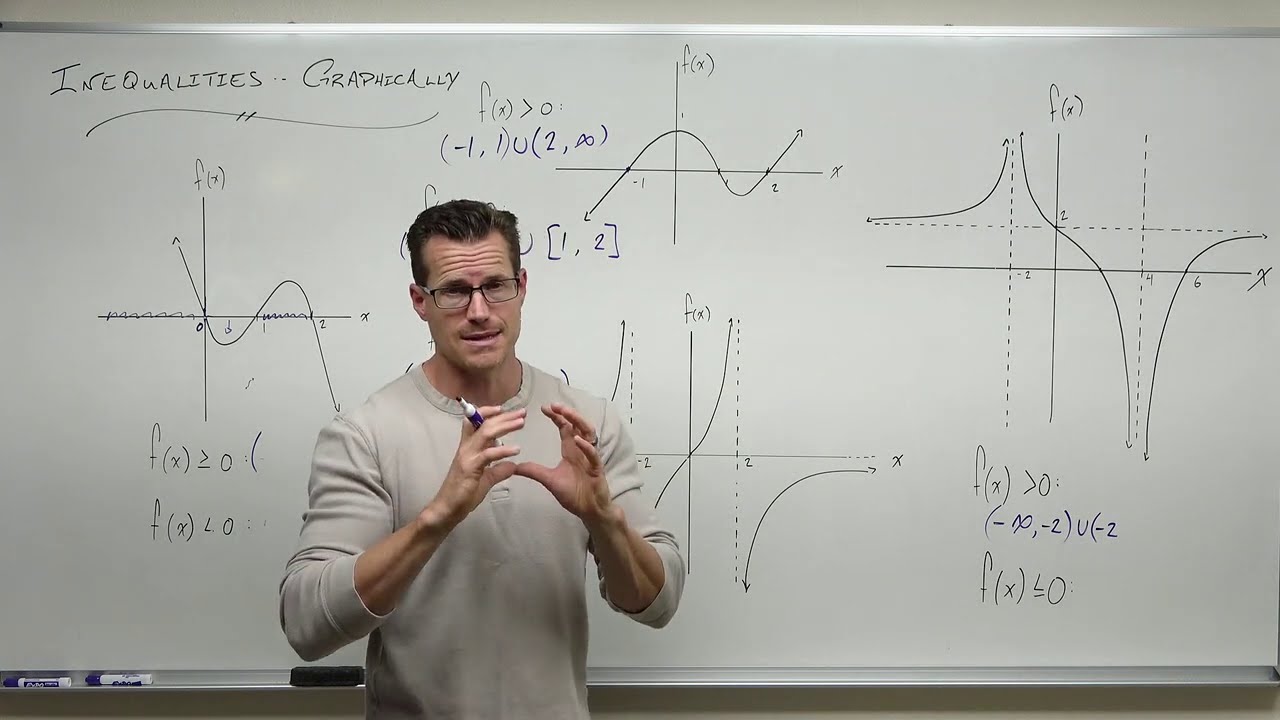
📉 Graphical and Direct Methods for Solving Inequalities
The second paragraph delves deeper into the two methods for solving inequalities. It explains that by understanding the function's relationship with the x-axis and the x-intercepts, one can easily identify intervals where the function is below the x-axis. The paragraph also explores the concept of 'bouncing' and 'crossing' at x-intercepts, which are crucial for determining the function's behavior. It further illustrates how to represent these behaviors on a number line and how to use them to find the intervals where the function is negative.
🤔 Testing Values as an Alternative to Graphing
This paragraph introduces an alternative method for solving inequalities by testing values in different intervals of the x-axis. It explains that this method may be more time-consuming but can be effective if done carefully. The speaker provides a step-by-step guide on how to test values, emphasizing the importance of considering the function's behavior at x-intercepts, which can either 'bounce' (maintaining the same sign) or 'cross' (changing sign). The paragraph also offers a shortcut for testing values by plugging in zero or a number close to zero.
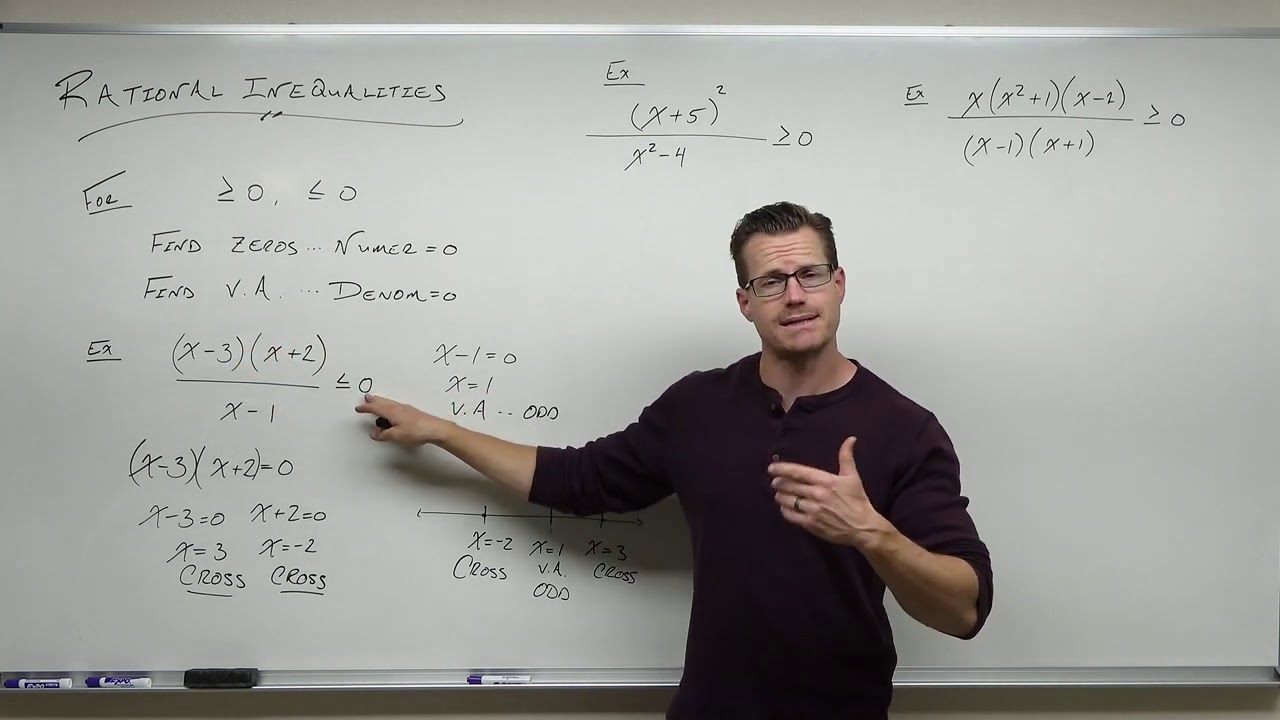
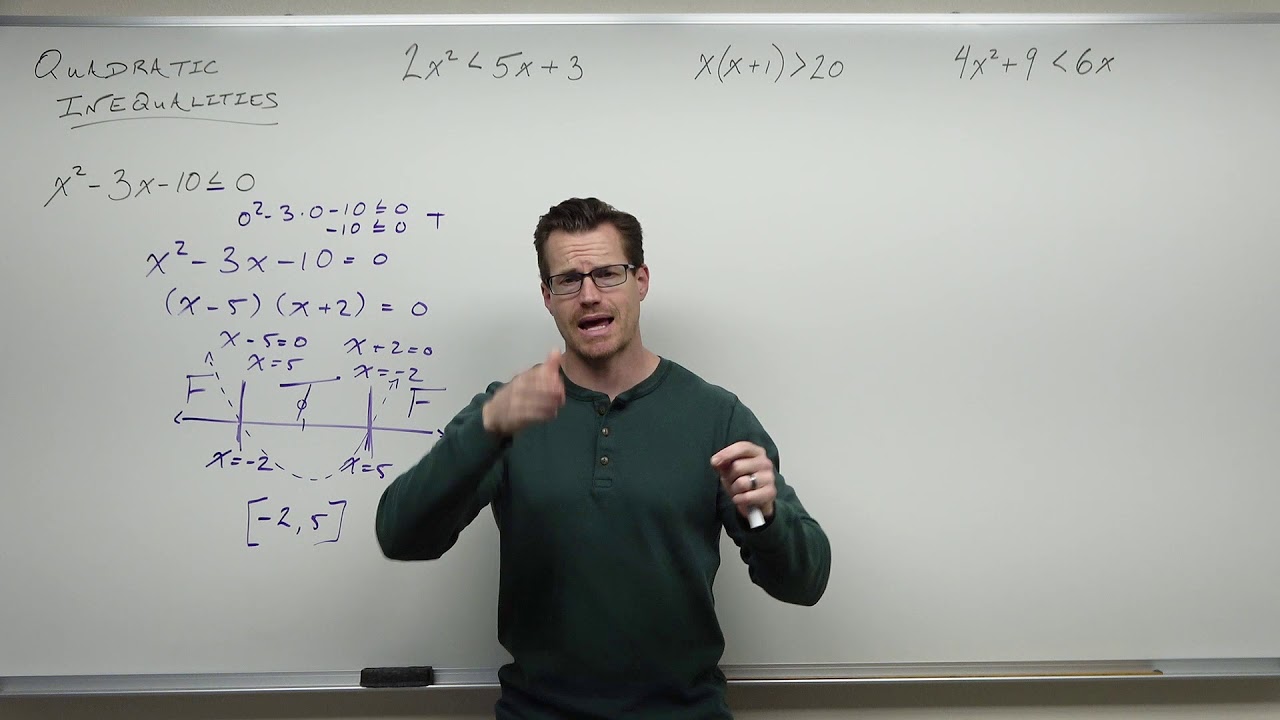
📚 Factoring and Identifying X-Intercepts
The fourth paragraph focuses on the process of factoring polynomials and identifying x-intercepts to solve inequalities. It discusses how to determine whether an x-intercept is a bounce or a cross and how this information can be used to find the intervals where the function is above or on the x-axis. The paragraph also highlights the importance of including x-intercepts when the inequality involves 'greater than or equal to' conditions.
🔍 Analyzing the Function's Behavior Over Intervals
This paragraph explores the behavior of a cubic function in relation to a linear function and how to determine where the cubic function's outputs are greater than those of the linear function. It explains the process of translating the problem into a simpler form that can be solved by finding where the cubic function is above the x-axis. The paragraph also demonstrates how to factor the cubic function to find x-intercepts and how to use these to identify the true and false intervals.
📐 Graphing Technique and Value Testing
The sixth paragraph presents two techniques for solving inequalities: the graphical method and the value testing method. It explains that the graphical method helps solidify the function's graph in the mind, while the value testing method offers a quicker way to find the solution. The paragraph demonstrates how to use both methods to find the intervals where a cubic function is above the x-axis and discusses the importance of including x-intercepts in the solution.
🧮 Factoring and Solving a Power Function Inequality
The final paragraph deals with solving an inequality involving a power function greater than one. It explains the process of factoring the inequality and using the concept of vertical shifts to simplify the problem. The paragraph also discusses the importance of understanding the function's end behavior and how it affects the intervals where the function is greater than zero. It concludes with a reminder of the importance of understanding the concepts of crossing and bouncing in relation to inequalities.
Mindmap
Keywords
💡Inequalities
💡Polynomials
💡Graphical Perspective
💡X-Intercepts
💡Factored Version
💡Rational Functions
💡End Behavior
💡Interval Notation
💡Zero Product Property
💡Bounces and Crosses
💡Testing Values
Highlights
Inequalities related to polynomials are discussed, emphasizing the importance of understanding the function's relationship with zero and the x-axis intervals.
Two approaches to solving inequalities are introduced: a graphical method and a value-testing method.
The concept of x-intercepts is crucial for determining where a graph crosses or bounces, affecting the intervals of the function's behavior.
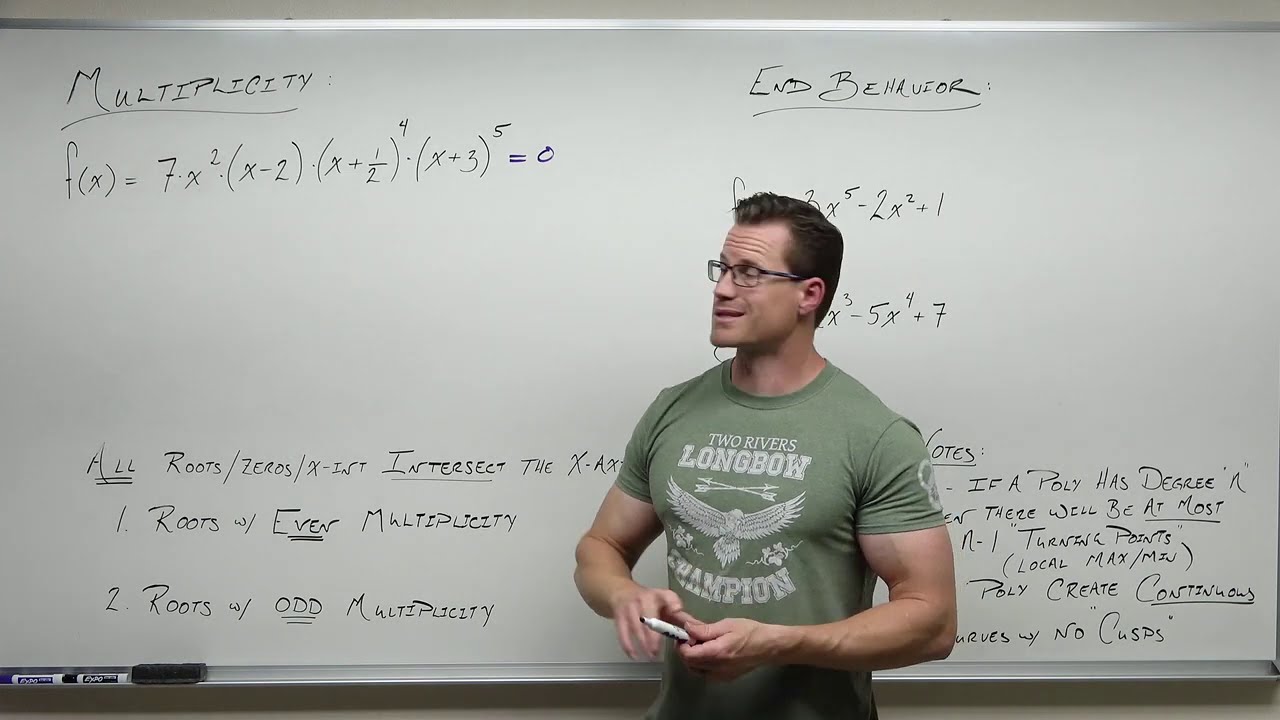
The video demonstrates how to identify whether x-intercepts are crossings or bounces by analyzing the factor's multiplicity.
The end behavior of polynomials is used to predict the general shape of the graph and its relationship to the x-axis.
The graphical approach to inequalities is shown to help solidify the mental picture of the graph and prevent mistakes.
An alternative method of testing values is presented as a time-saving strategy, with caution advised for careful application.
The principle of 'alternating truth' for quadratic inequalities is explained and contrasted with the behavior of higher degree polynomials.
The video illustrates how to adjust the approach based on the inequality's requirement, such as 'less than' or 'greater than zero'.
The importance of including x-intercepts when the inequality involves 'greater than or equal to' is highlighted.
A technique for quickly determining the truth value of an interval using the concepts of bounces and crosses is introduced.
The video emphasizes the continuity of polynomials and the implications for the graph's behavior without asymptotes or holes.
A step-by-step guide to factoring and finding x-intercepts is provided for solving cubic inequalities.
The concept of 'truth intervals' is explained, showing how to identify the sections of the x-axis where the inequality holds true.
The video concludes with a reminder of the connection between graphing and inequalities, encouraging a deep understanding for tackling more complex rational inequalities in future lessons.
Transcripts
Browse More Related Video
Inequalities with Rational Functions (Precalculus - College Algebra 47)
Solving Quadratic Inequalities (Precalculus - College Algebra 25)
Inequalities with Functions - Graphically (Precalculus - College Algebra 45)
Ch. 3.7 Polynomial and Rational Inequalities
Solving and Graphing Polynomial and Rational Inequalities
Multiplicity and End Behavior of Polynomials (Precalculus - College Algebra 29)
5.0 / 5 (0 votes)
Thanks for rating: