Probability and Statistics Made Easy: Essential for Data Scientists
TLDRIn this educational video, Emma clarifies the distinction between probability and statistics, focusing on the roles of descriptive and inferential statistics. Descriptive statistics summarize data, while inferential statistics make broader inferences about populations. Probability theory, which assigns likelihoods to events, provides the mathematical backbone for statistics, enabling data-driven conclusions with an element of uncertainty. The video also touches on Bayesian and frequentist interpretations of probability, highlighting their importance in choosing statistical techniques.
Takeaways
- 😀 Probability and statistics are often confused but they serve different purposes and are closely related.
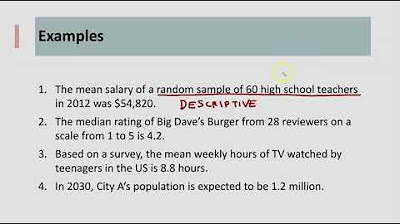
- 📊 Descriptive statistics describe a sample through summary statistics and visual representation like bar and line charts.
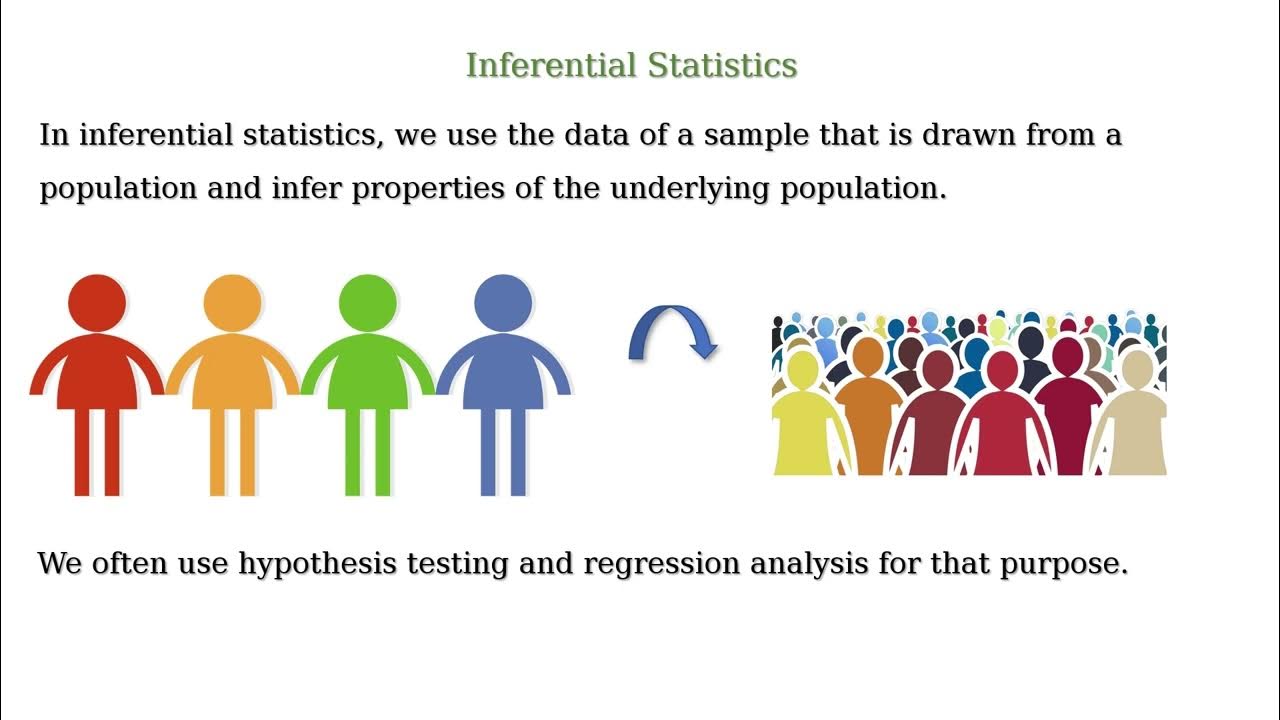
- 🔍 Inferential statistics make inferences about a population based on a sample, involving uncertainty quantified by probability.
- 📈 An example of descriptive statistics is analyzing data science job market trends from thousands of job postings.
- 🤔 Inferential statistics are used to generalize findings, like the popularity of programming languages among data scientists, to a larger population.
- 🎯 Probability reflects the likelihood of an event occurring, with values ranging between 0 and 1.
- 🧩 Probability theory provides a framework for modeling complex systems and understanding behaviors through patterns, like the law of large numbers.
- 🔮 Probability theory and inferential statistics are inversely related; the former models before data is observed, while the latter infers after data is collected.
- 📚 Inferential statistics apply probability theory to draw conclusions from observed data, using it as a mathematical foundation.
- 🤷♂️ Bayesian inference and frequentist inference are two schools of thought in statistics, differing in their interpretation of probability.
- 🌐 The video aims to clarify the differences and relationships between descriptive and inferential statistics, and between probability and statistics.
Q & A
What is the main topic of the video?
-The main topic of the video is to explain the difference between probability and statistics, and their relationship.
What are the two areas of statistics mentioned in the video?
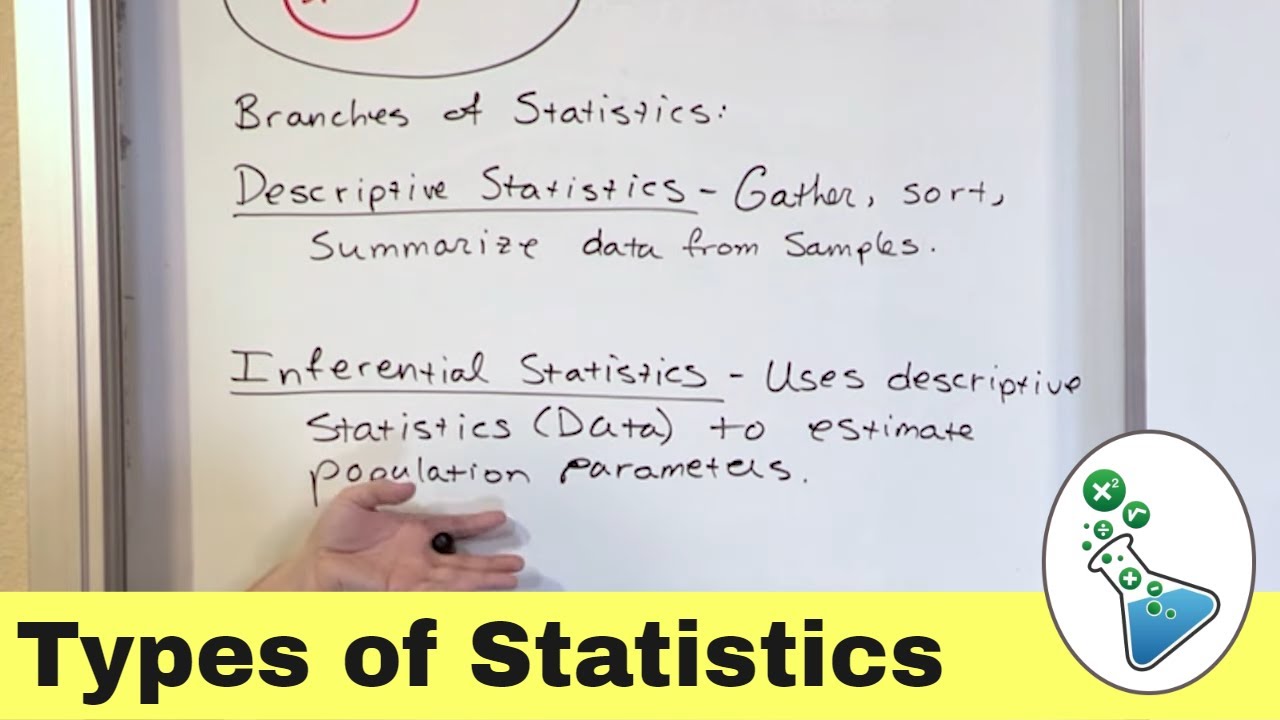
-The two areas of statistics mentioned are descriptive statistics and inferential statistics.
What is the purpose of descriptive statistics?
-Descriptive statistics are used to describe a sample by obtaining data and calculating summary statistics, often displayed visually in graphs.
How does inferential statistics differ from descriptive statistics?
-Inferential statistics use data from a sample to make inferences about the population, involving uncertainty and generalizing conclusions to a larger population.
What is an example of how the video illustrates the use of inferential statistics?
-The video uses an example of analyzing data science job market trends from over 3000 job postings to make conclusions about all job openings for data scientists in the US.
What is the basic definition of probability?
-Probability reflects the likelihood that a particular event will occur and is a number between 0 and 1.
What is probability theory and how does it differ from inferential statistics?
-Probability theory is a mathematical framework for modeling complex systems and capturing uncertainty in outcomes. It differs from inferential statistics in that it models universal patterns without needing observed data, whereas inferential statistics infer general properties from observed data.
How does the video explain the relationship between probability theory and inferential statistics?
-The video explains that probability theory provides a mathematical foundation for statistics, and statistics apply probability theory to model and observe data.
What are the two schools of inferential statistics mentioned in the video?
-The two schools of inferential statistics mentioned are Bayesian inference and frequentist inference.
What is the difference between Bayesian and frequentist interpretations of probability?
-Bayesian inference interprets probability as a degree of belief and updates probabilities based on prior knowledge and observed data. Frequentist inference views probability as the limit of relative frequency of an event after many trials.
What is the final message of the video regarding the relationship between probability and statistics?
-The final message is that probability and statistics are closely related, with probability theory providing the framework for statistical inference, and statistics applying this framework to observed data.
Outlines
📊 Understanding Probability and Statistics
This paragraph introduces the topic of the video, which is the distinction between probability and statistics. The speaker, Emma, aims to clarify these concepts that are often used interchangeably but have different meanings. The paragraph outlines the plan of the video to first explain descriptive and inferential statistics, then to differentiate between probability and statistics, and finally to explore the relationship between the two. Descriptive statistics are used to summarize and visually represent data from a sample, while inferential statistics extend conclusions from a sample to a larger population, involving a degree of uncertainty typically expressed through probabilities. An example from a data science job market analysis is given to illustrate the use of inferential statistics.
🎯 The Relationship Between Probability Theory and Inferential Statistics
The second paragraph delves into the precise differences between probability theory and inferential statistics, highlighting their relationship with observed data. Probability theory is presented as a mathematical framework for modeling uncertain outcomes and can be used to design models before any data is observed, focusing on universal patterns. In contrast, inferential statistics is applied after data has been collected, with the goal of inferring general properties about a population from a sample. The paragraph further explains that probability theory is deductive, reasoning from the population to the sample, while inferential statistics is inductive, moving from the sample to the population. The video also touches on the two schools of thought in inferential statistics: Bayesian inference, which incorporates prior beliefs and updates them with new evidence, and frequentist inference, which views probability as the long-term frequency of an event occurring. The paragraph concludes by emphasizing the close relationship between probability theory and statistics, with the former providing the mathematical foundation for the latter.
Mindmap
Keywords
💡Probability
💡Statistics
💡Descriptive Statistics
💡Inferential Statistics
💡Sample
💡Population
💡Uncertainty
💡Data Science Job Market Trend
💡Probability Theory
💡Law of Large Numbers
💡Bayesian Inference
💡Frequentist Inference
Highlights
The video aims to clarify the difference between probability and statistics, and their relationship.
Statistics is divided into descriptive and inferential statistics, with descriptive focusing on sample data summary.
Inferential statistics use sample data to make inferences about the larger population, involving uncertainty.
Descriptive statistics are straightforward and visual, often displayed in graphs and charts.
Probability quantifies conclusions in inferential statistics, acknowledging the lack of 100% confidence.
An example of descriptive statistics is analyzing data science job market trends from various career portals.
Inferential statistics are used to generalize findings, such as the popularity of programming languages, to the entire population of job postings.
Probability reflects the likelihood of an event occurring, with values ranging from 0 to 1.
Probability theory provides a framework for modeling complex systems and behaviors.
The law of large numbers is a formal concept from probability theory that describes the behavior of random events over many trials.
The difference between probability theory and inferential statistics lies in their approach to observed data.
Probability theory models universal patterns without needing observed data, using deductive reasoning.
Inferential statistics use observed data to infer general properties about the population, employing inductive reasoning.
The relationship between probability theory and inferential statistics is that the former provides the mathematical foundation for the latter.
There are two schools of inferential statistics: Bayesian inference and frequentist inference, differing in their interpretation of probability.
Bayesian inference views probability as a degree of belief, updating it with new evidence using Bayes' theorem.
Frequentist inference sees probability as the limit of relative frequency after many trials, using techniques like hypothesis testing and p-values.
Understanding the fundamentals of probability theory is crucial for conducting statistical inference.
The video concludes by emphasizing the close relationship and practical applications of probability and statistics in data science.
Transcripts
Browse More Related Video


5.0 / 5 (0 votes)
Thanks for rating: