What is Descriptive Vs. Inferential Statistics?
TLDRThe transcript discusses the fundamental concepts of statistics, differentiating between descriptive and inferential statistics. Descriptive statistics involve gathering, sorting, and summarizing data from samples to describe something, often visualized through charts or graphs. Inferential statistics, on the other hand, use this descriptive data to draw conclusions or make inferences about the larger population. The transcript emphasizes the importance of understanding these definitions and the relationship between a sample and its population in statistical analysis.
Takeaways
- 📊 A sample is a subset of the population of interest, used when it's impractical to interact with the entire population.
- 🌟 The concept of a population could be all chipmunks in Texas, all butterflies in the world, or all people over 50 in North America.
- 🎨 A picture can help understand the relationship between a population and a sample, emphasizing the sample as a smaller part of the larger population.
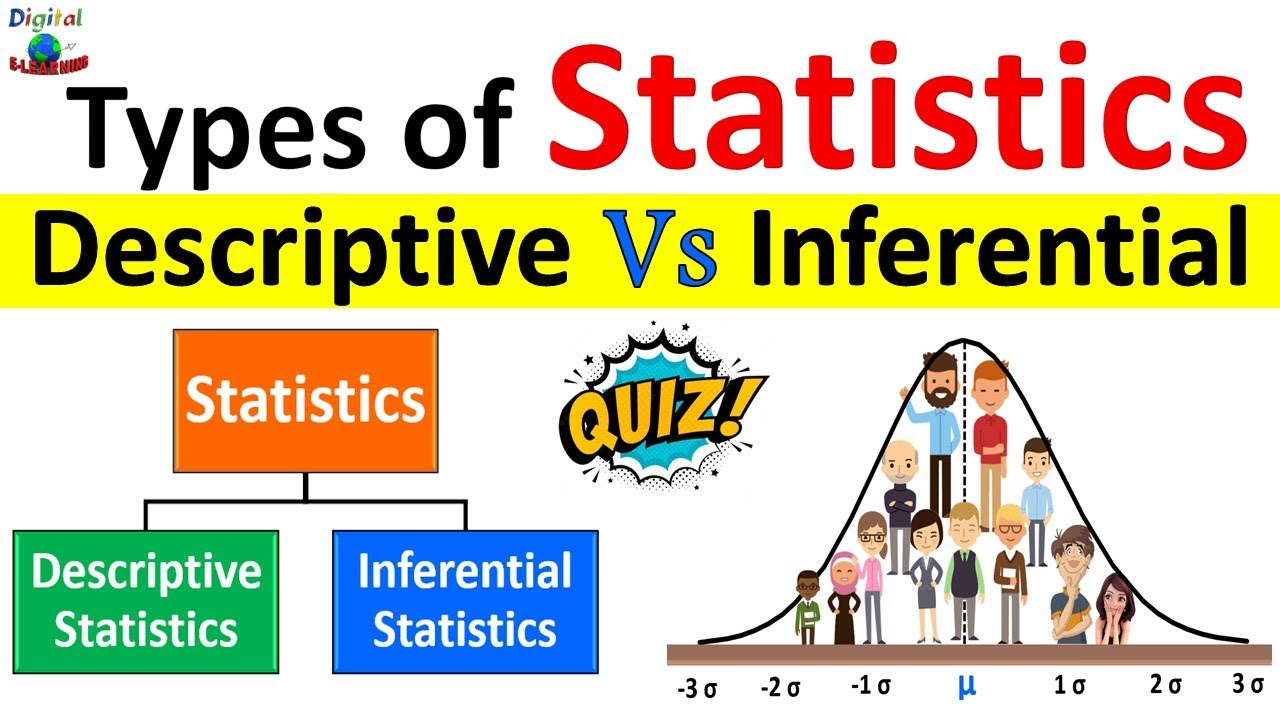
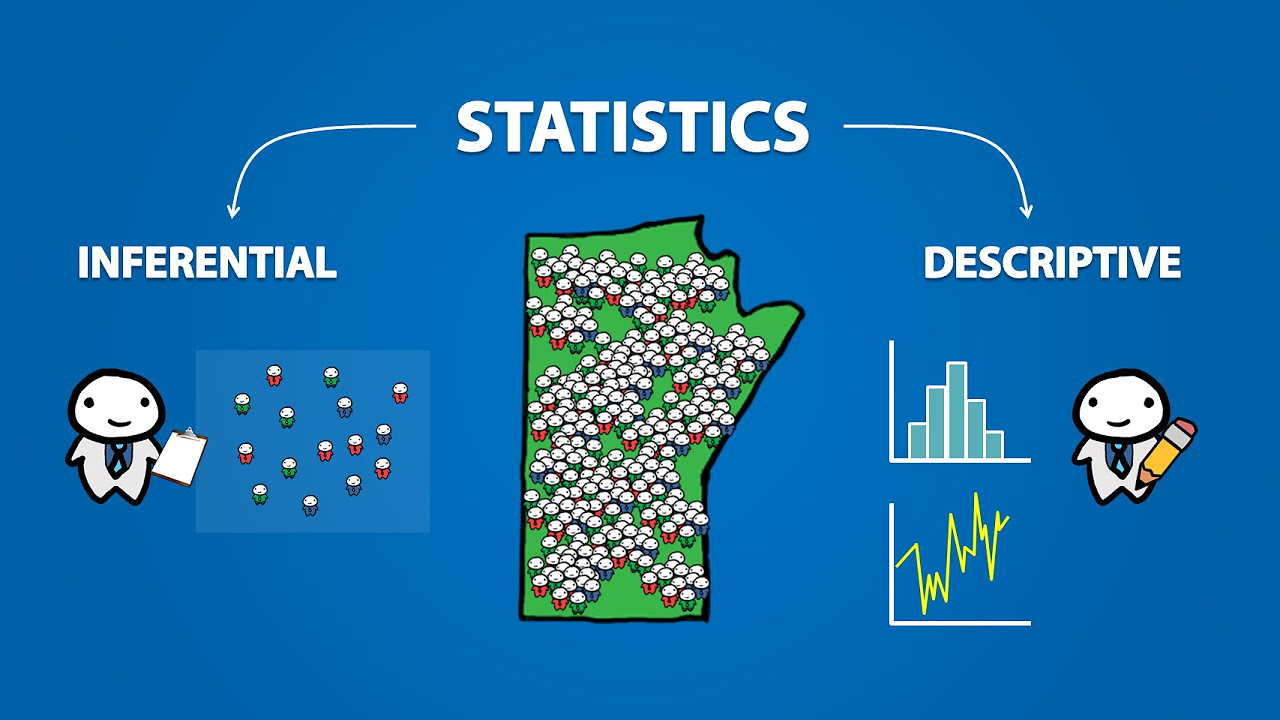
- 📈 There are two main branches of statistics: descriptive and inferential. Descriptive statistics describe and summarize data, while inferential statistics draw conclusions from data about a population.
- 🔍 Descriptive statistics involve gathering, sorting, and summarizing data, often through charts, graphs, or tables.
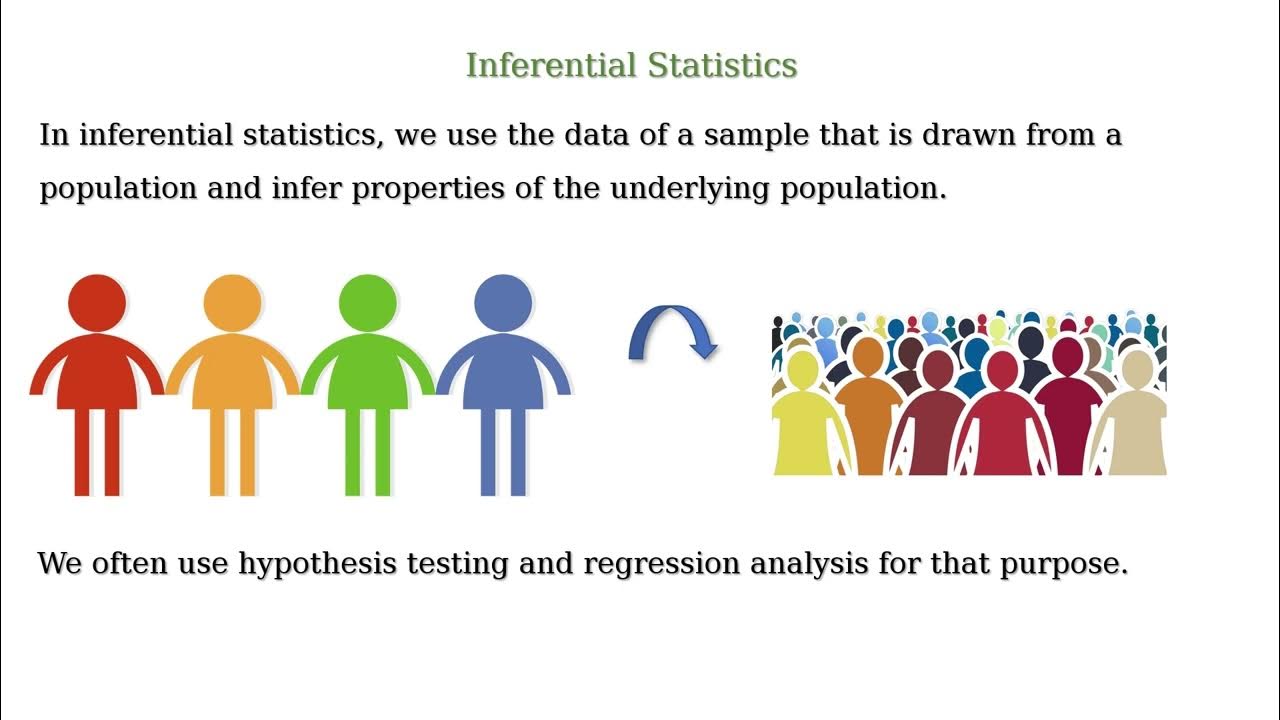
- 🤔 Inferential statistics use the data from a sample to estimate population parameters, acknowledging that it's rare to know population parameters with absolute certainty.
- 🌐 Estimating population parameters involves using sample data to make educated guesses about the larger group that the sample is a part of.
- 📱 An example of inferential statistics is a phone survey concluding that 22% of all men dislike football, based on the responses gathered.
- 🎓 A key distinction between descriptive and inferential statistics is whether the data is being used to describe or to draw a broader conclusion about a population.
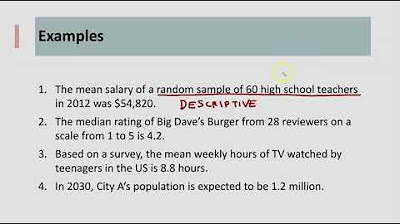
- 🏫 Another example is that 65% of seniors at a local high school planning to major in business is a descriptive statistic, as it's merely presenting a fact without drawing a conclusion about all seniors in America.
- 🚀 Understanding these definitions is crucial for grasping future concepts in statistics, especially when it comes to calculations and interpretations of data.
Q & A
What is the main difference between a population and a sample?
-A population is the entire group that you are interested in studying, while a sample is a smaller subset of that population. It is impractical to study the entire population, so researchers often rely on samples to draw conclusions about the population.
How can a picture help in understanding the concepts of population and sample?
-A picture can visually represent the relationship between a population and a sample. It can illustrate the idea that the sample is a smaller part taken from the larger population, which helps in grasping the concept more effectively.
What are the two main branches of statistics mentioned in the transcript?
-The two main branches of statistics are descriptive statistics and inferential statistics.
What is descriptive statistics and what does it involve?
-Descriptive statistics involves gathering, sorting, and summarizing data from samples. It is used to describe and present data through charts, graphs, or tables without drawing broad conclusions.
Explain the concept of inferential statistics.
- Inferential statistics uses descriptive statistics to estimate population parameters. It involves drawing conclusions or making inferences about a population based on data collected from a sample.
Why is it important to distinguish between descriptive and inferential statistics?
-Distinguishing between the two is crucial because they serve different purposes. Descriptive statistics help in presenting data, while inferential statistics allow for making predictions or estimations about a population based on sample data. Understanding this difference prevents confusion when interpreting statistical results.
How does the size of the sample affect the accuracy of population parameter estimation?
-The larger and more representative the sample, the more accurate the estimation of the population parameters will be. A larger sample size generally leads to a better approximation of the true population characteristics.
What is the population parameter in the context of the phone survey about men disliking football?
-The population parameter in this context is the percentage of all men who dislike football. The phone survey is used to infer this parameter based on the responses from the sampled men.
In the high school seniors example, why is the statistic considered descriptive?
-The statistic is considered descriptive because it simply presents the fact that 65 percent of the surveyed high school seniors plan to major in business. It does not attempt to draw a broader conclusion about all seniors across America or make an inference about the entire population.
What is the main takeaway from the discussion about populations and samples?
-The main takeaway is to understand the distinction between a population (the entire group of interest) and a sample (a smaller part of the population). This understanding is crucial for grasping the concepts of descriptive and inferential statistics and for correctly interpreting statistical analyses.
How does the process of inferential statistics help in statistical analysis?
-Inferential statistics helps in statistical analysis by allowing researchers to make predictions and estimations about population parameters based on sample data. This process enables the drawing of conclusions from a manageable subset of data, which would be impossible or impractical to collect from the entire population.
Outlines
📊 Introduction to Population and Sample
The paragraph introduces the concepts of population and sample in statistics. A population is the entire group that is being studied, which could be all chipmunks in Texas or all people over 50 in North America. A sample is a smaller subset of this population that is interacted with for the purpose of study. The importance of understanding the difference between population and sample is emphasized, as it affects the calculations and conclusions drawn in statistical analysis. The paragraph also introduces the two branches of statistics: descriptive and inferential, with descriptive focusing on gathering and summarizing data, and inferential using this data to estimate population parameters and draw conclusions.
🔍 Estimating Population Parameters through Inferential Statistics
This paragraph delves deeper into the process of using inferential statistics to estimate population parameters. It explains that it is impractical to gather data from every individual in a population, hence the reliance on samples. The paragraph uses the example of estimating the percentage of Americans who like pepperoni pizza through a survey. It highlights that the larger and more representative the sample, the closer the estimate will be to the actual population parameter. The paragraph emphasizes the importance of understanding the definitions of population and parameter, and how they are used in inferential statistics to make informed conclusions.
📈 Differentiating Descriptive and Inferential Statistics
The paragraph clarifies the distinction between descriptive and inferential statistics. Descriptive statistics involve collecting and presenting data, often in the form of charts or graphs, without drawing broad conclusions. Inferential statistics, on the other hand, use the data collected through descriptive methods to make inferences about the larger population. The paragraph provides examples to illustrate the difference, such as a phone survey estimating the percentage of men who dislike football (inferential) versus reporting that 65% of seniors at a local high school plan to major in business (descriptive). The key takeaway is understanding when statistics are being used to describe data versus when they are used to make broader inferences about a population.
Mindmap
Keywords
💡Population
💡Sample
💡Subset
💡Descriptive Statistics
💡Inferential Statistics
💡Population Parameters
💡Estimate
💡Sample Size
💡Data Collection
💡Representative Survey
Highlights
The concept of a population and sample is introduced, with a sample being a subset of the population of interest.
A visual representation of the population and sample is suggested to aid understanding.
Two main branches of statistics are mentioned: descriptive and inferential statistics.
Descriptive statistics involve gathering, sorting, and summarizing data from samples.
Inferential statistics use descriptive statistics to estimate population parameters and draw conclusions.
The importance of understanding the definitions of population and parameter is emphasized.
An example of inferential statistics is provided, where a phone survey estimates the percentage of men who dislike football.
A distinction is made between descriptive and inferential statistics using the example of high school seniors planning to major in business.
The process of estimating population parameters from a sample is discussed, highlighting the difficulty of knowing the true population parameters.
The concept of a sample being a smaller, representative part of the larger population is reiterated.
The importance of sample size and the quality of data collection for accurate estimation is mentioned.
Descriptive statistics are used to present facts without drawing broad conclusions, while inferential statistics involve making inferences about a population.
A clear definition of population parameters is provided, describing numerically something about the population.
The process of using data from a sample to estimate population parameters is outlined.
The concept of inferential statistics is further clarified with the example of estimating the percentage of Americans who like pepperoni pizza.
The transcript emphasizes the importance of understanding the difference between descriptive and inferential statistics for future statistical analysis.
The transcript concludes with a reminder to keep the image of populations and samples in mind for upcoming concepts.
Transcripts
Browse More Related Video
Descriptive vs Inferential Statistics

Descriptive Statistics vs Inferential Statistics
Descriptive Statistics vs Inferential Statistics | Measure of Central Tendency | Types of Statistics
Descriptive Statistics vs. Inferential Statistics
Introduction to Statistics (1.1)

Probability and Statistics Made Easy: Essential for Data Scientists
5.0 / 5 (0 votes)
Thanks for rating: