What is Statistics? | Types of Statistics | Descriptive & Inferential Statistics | Acadgild
TLDRThe video script introduces statistics as a vital tool for decision-making, emphasizing its role in analyzing and interpreting data. It distinguishes between descriptive and inferential statistics, using examples such as a business campaign and an election survey to illustrate their applications. Descriptive statistics are highlighted for organizing and presenting data, while inferential statistics are showcased for drawing conclusions from samples to infer outcomes for larger populations.
Takeaways
- 📊 Statistics is a science that involves data collection, organization, presentation, analysis, and interpretation for effective decision-making.
- 🔍 Statistical analysis is used to manipulate, summarize, and investigate data to extract valuable insights for decision-making.
- 🏢 Businesses, such as an online cloud selling company, can use statistics to determine the effectiveness of campaigns and predict customer behavior.
- 📈 Experiment design in statistics helps in deciding whom to send campaigns to and how to measure the outcomes based on customer responses.
- 🛒 By comparing the purchasing behavior of customers who received advertisements to those who did not, one can gauge the effectiveness of marketing strategies.
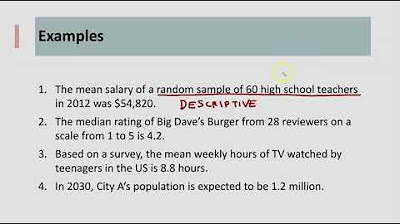
- 🔑 Descriptive statistics organize, summarize, and present data in an informative way, providing insights into business operations and customer demographics.
- 🗳️ Inferential statistics involve making inferences about a population based on a selected sample, such as predicting election outcomes.
- 📝 The distinction between descriptive and inferential statistics is crucial for understanding the different applications and goals within the field of statistics.
- 🌟 Statistics play a vital role in making informed decisions by providing a systematic approach to understanding and utilizing data.
- 🔑 Properly designed experiments and the analysis of results can lead to significant insights that drive business growth and strategy.
- 📊 Understanding the difference between the entire population and the sample within statistical analysis is key to accurate data interpretation and decision-making.
Q & A
What is the definition of statistics?
-Statistics is the science of collecting, organizing, presenting, analyzing, and interpreting data to help in making effective decisions.
What is the purpose of statistical analysis?
-The purpose of statistical analysis is to manipulate, summarize, and investigate data to obtain useful decision-making information and results.
How can statistical analysis be applied in a business context, such as an online cloud selling company?
-Statistical analysis can be used to design experiments, determine whom to send campaigns to, and measure the effectiveness of those campaigns based on customer responses and purchases.
What are the two types of statistical analysis?
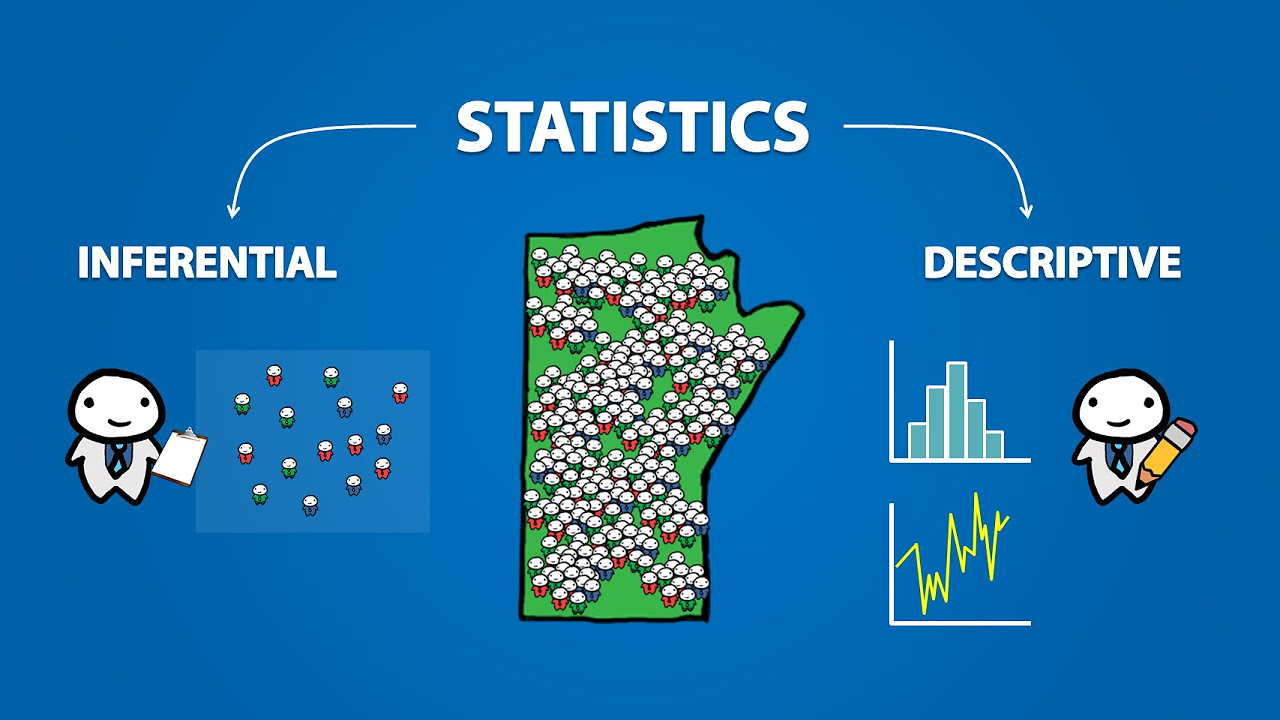
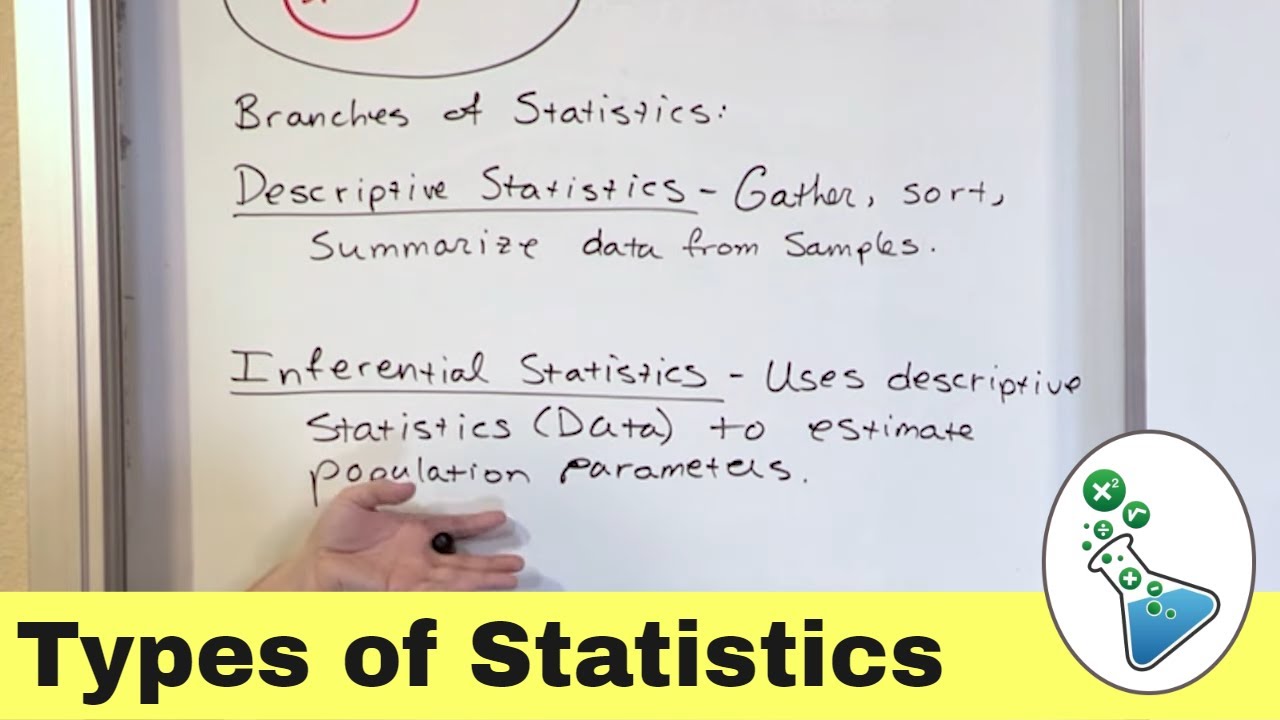
-The two types of statistical analysis are descriptive statistics and inferential statistics.
What is descriptive statistics and how is it used?
-Descriptive statistics is a method of organizing, summarizing, and presenting data in an informative way. It helps to understand the trends and patterns in a business, such as customer behavior, inventory management, and sales performance.
What is inferential statistics and how does it differ from descriptive statistics?
- Inferential statistics involves making inferences about a population based on a sample. Unlike descriptive statistics, which deals with the data at hand, inferential statistics tries to draw conclusions about a larger group or situation, such as predicting election outcomes based on a sample survey.
How can inferential statistics be used to understand election outcomes?
-By selecting a representative sample of the population, inferential statistics can be used to estimate which party is likely to get more votes in an election. The analysis is based on the responses from the sampled individuals and allows for conclusions about the entire voting population.
What is the role of probability in statistical analysis?
-Probability plays a crucial role in statistical analysis by helping to understand the likelihood of certain outcomes. It assists in determining the confidence level in the results of the research and the feasibility of the questions being answered.
What are the potential risks of relying on statistical analysis?
-Statistical analysis, while valuable, is not perfect and can have known or unknown issues that affect the results. The conclusions drawn from it are often approximate, and it's important to remember that it doesn't guarantee correct results. This can be particularly risky when making critical business decisions.
How does statistical analysis help in making data-informed decisions?
-Statistical analysis helps in making data-informed decisions by identifying trends and patterns in the data. It allows businesses to understand their customers better, improve their services and products, and make strategic decisions based on empirical evidence.
What is the importance of understanding both descriptive and inferential statistics in decision-making?
-Understanding both descriptive and inferential statistics is crucial in decision-making as it provides a comprehensive view of the data. Descriptive statistics offer insights into the current state of affairs, while inferential statistics allow for predictions and conclusions about larger populations or future events.
Outlines
📊 Introduction to Statistics and its Applications
This paragraph introduces the fundamental concept of statistics, which is the science of collecting, organizing, presenting, analyzing, and interpreting data to aid in effective decision-making. It explains the importance of statistical analysis in various scenarios, such as running a business or an online cloud selling company, where one might want to determine the effectiveness of a campaign based on customer behavior. The paragraph outlines the process of designing an experiment, including deciding whom to send the campaign to and how to measure its success. It also distinguishes between descriptive and inferential statistics, providing examples of how each type is applied in real-world situations. Descriptive statistics are used to summarize and present data in an informative way, such as understanding customer demographics and purchasing patterns. In contrast, inferential statistics involve making inferences about a larger population based on a sample, as in the case of predicting election outcomes.
Mindmap
Keywords
💡Statistics
💡Data Analysis
💡Decision-making
💡Descriptive Statistics
💡Inferential Statistics
💡Marketing Campaign
💡Sample Size
💡Population
💡Experiment Design
💡Customer Behavior
💡Data Interpretation
Highlights
Statistics is the science of collecting, organizing, presenting, analyzing, and interpreting data.
Statistical analysis is used to make effective decisions by manipulating and investigating data.
Descriptive statistics organizes, summarizes, and presents data in an informative way.
Inferential statistics helps to infer conclusions about a population based on a sample.
An example of using statistics in business is to design and analyze the effectiveness of marketing campaigns.
To determine the effectiveness of a campaign, one must decide whom to send the campaign to and how many.
Comparing customer behavior, such as clicking on advertisements and making purchases, can establish campaign effectiveness.
Statistics can help establish whether customers would have made purchases regardless of receiving advertisements.
Descriptive statistics can reveal insights about business operations, such as inventory levels and customer demographics.
By analyzing data, businesses can understand which products sell more at specific times or attract certain customer types.
Inferential statistics is used in scenarios like elections where it's impractical to survey every individual.
A sample size is chosen to make inferences about the entire population in inferential statistics.
Inferential statistics can determine which political party may receive more votes based on a sample of voters.
The population in inferential statistics refers to the entire group being studied, such as all voters in an election.
A sample in inferential statistics is a subset of the population that is surveyed or analyzed.
Statistics is crucial for making informed decisions in both business and social sciences.
The field of statistics encompasses both the description and inference of data for effective analysis.
Understanding statistics allows for better decision-making and prediction in various fields.
Transcripts


5.0 / 5 (0 votes)
Thanks for rating: