Descriptive vs Inferential Statistics
TLDRThe video script provides a clear explanation of the fundamental concepts of statistics, differentiating between descriptive and inferential statistics. Descriptive statistics involve the collection, organization, summarization, and presentation of data from a sample, whereas inferential statistics use this sample data to make predictions or draw conclusions about the larger population. The script emphasizes the importance of understanding these concepts and their applications, as they form the basis of statistical analysis. It walks through several examples to illustrate the differences, such as the mean salary of a sample of teachers, the median rating from reviewers, and the estimated weekly hours of TV watched by teenagers in the U.S. The key takeaway is to discern whether the data is a direct result from a sample (descriptive) or if it's used to infer information about a population (inferential), which is crucial for correctly interpreting statistical results.
Takeaways
- 📚 **Importance of Vocabulary**: The first week of the course focuses on introducing a lot of new vocabulary, which is crucial for understanding the rest of the material.
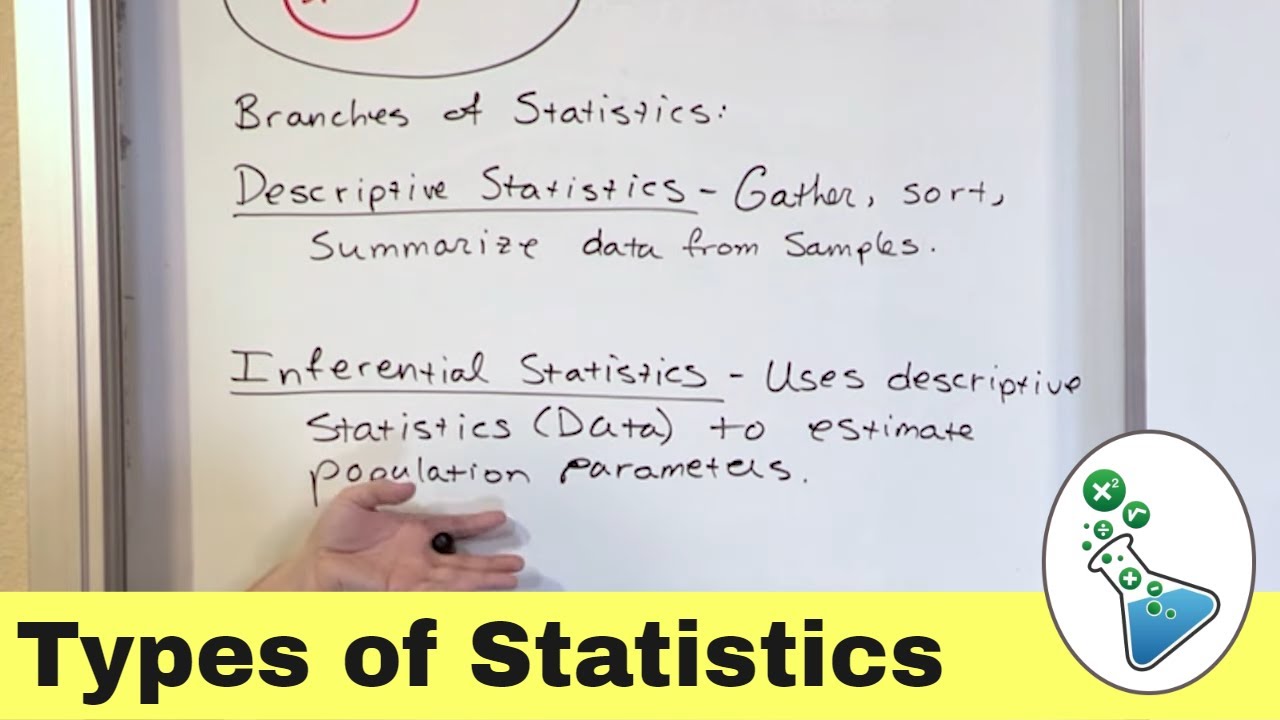
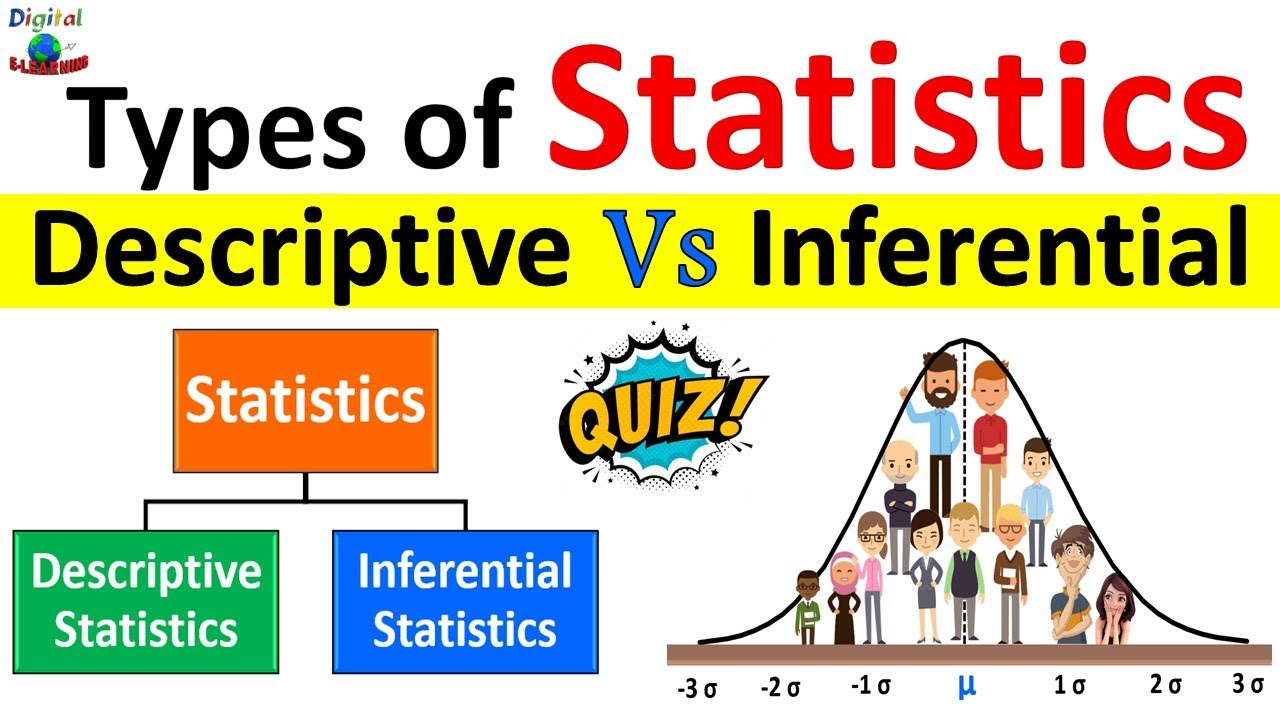
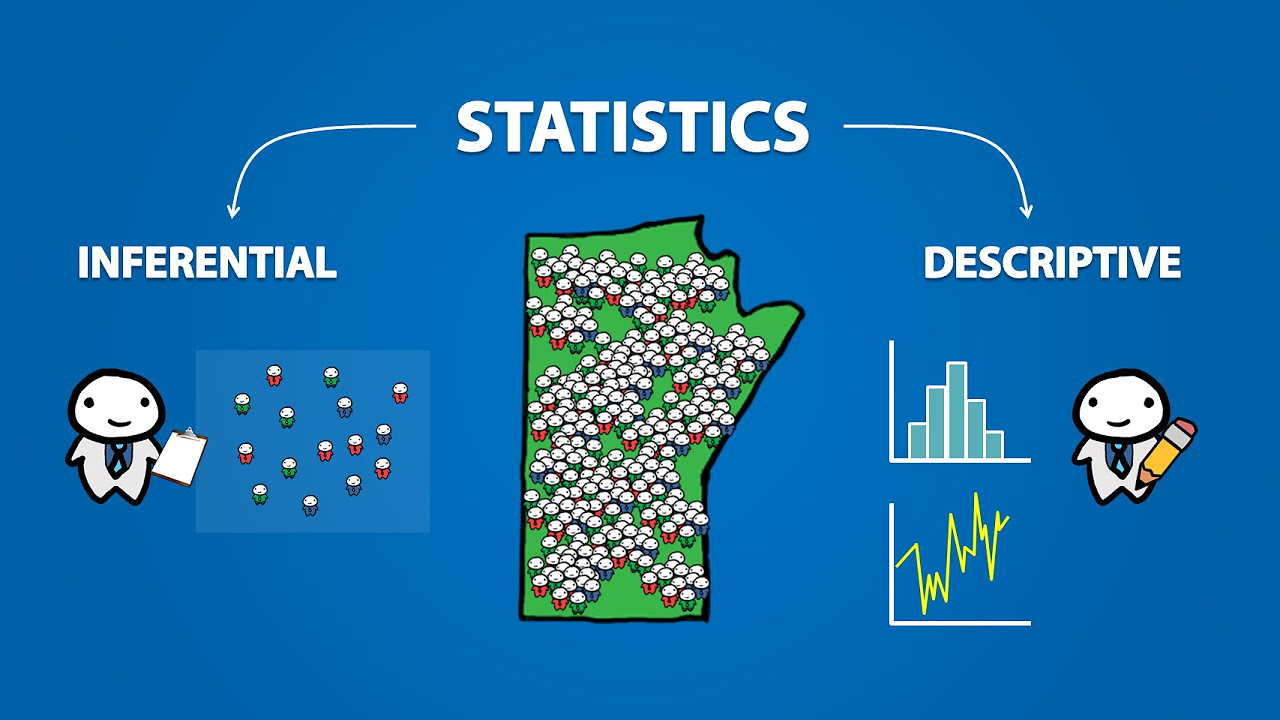
- 🔍 **Descriptive vs. Inferential Statistics**: Statistics is divided into descriptive (organizing, summarizing data from a sample) and inferential (using sample data to make predictions or draw conclusions about a population).
- 🌯 **Sample Data Usage**: We often rely on samples because entire populations are too large to study. Descriptive statistics involves collecting, organizing, and summarizing data from these samples.
- 📊 **Descriptive Statistics Defined**: Descriptive statistics includes the collection, organization, summarization, and presentation of data from a sample.
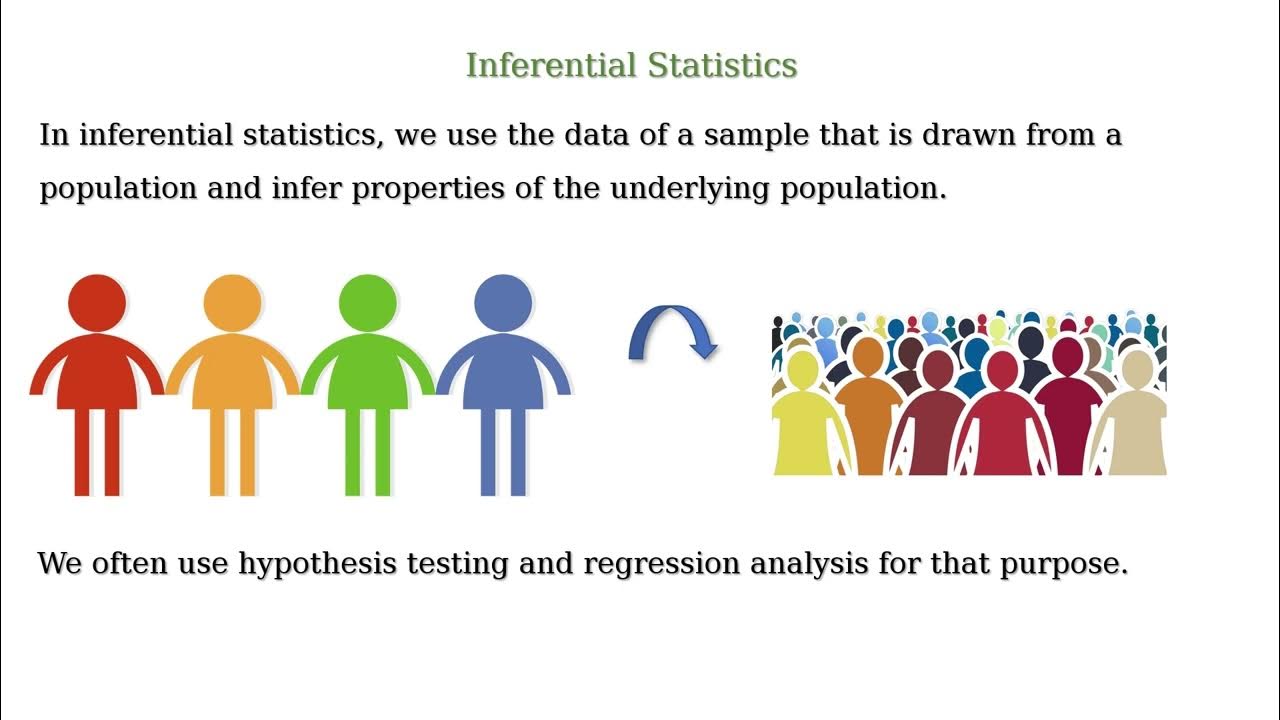
- 🔮 **Inferential Statistics Defined**: Inferential statistics involves generalizing from samples to populations, often using estimates and predictions to make conclusions about the larger group.
- 🎯 **Key to Identifying Statistics Type**: Determine if the data is a direct result from a sample (descriptive) or if it's an estimate/prediction about the population based on a sample (inferential).
- 🤔 **Understanding Example 1**: The mean salary from a sample of 60 high school teachers is an example of descriptive statistics, as it summarizes data from a specific sample.
- 🍔 **Understanding Example 2**: The median rating from a sample of 28 reviewers for Big Dave's burger is also descriptive, as it's a summary of a sample's opinions.
- 📺 **Understanding Example 3**: The mean weekly hours of TV watched by US teenagers, based on a survey, is inferential because it uses sample data to estimate a figure for the entire population.
- ⏲️ **Understanding Example 4**: The expected population of City A in 2030 is an example of inferential statistics, as it's a prediction based on sample data.
- 📈 **Careful Reading Required**: To distinguish between descriptive and inferential statistics, one must read examples carefully to understand whether they are summarizing a sample or inferring about a population.
- 📘 **Textbook Definitions**: The definitions provided in the textbook serve as a foundation for understanding the concepts of descriptive and inferential statistics.
Q & A
What is the main focus of the first week of the course?
-The main focus of the first week is to introduce and familiarize students with a lot of vocabulary that will be used throughout the course.
What are the two main types of statistics discussed in the script?
-The two main types of statistics discussed are descriptive statistics and inferential statistics.
What is the textbook definition of statistics?
-Statistics is defined as the science of conducting studies to collect, organize, summarize, analyze, and draw conclusions from data.
Why do we rely on samples in statistics?
-We rely on samples because often we cannot reach entire populations due to their large size. Instead, we take smaller random samples from the populations we're interested in to study.
What are the three parts of descriptive statistics?
-The three parts of descriptive statistics are collecting data, organizing that sample data, and summarizing that data.
How does inferential statistics differ from descriptive statistics?
-Inferential statistics involves using sample data to make predictions and draw conclusions about the larger population, whereas descriptive statistics focuses on summarizing data from a sample.
What is the key factor that distinguishes descriptive statistics from inferential statistics in examples?
-The key factor is whether the information or number presented comes directly from a sample (descriptive) or is used to estimate or predict something about the larger population based on the sample (inferential).
According to the script, what is the role of a sample in inferential statistics?
-In inferential statistics, a sample is used to make estimates or predictions about the larger population, allowing us to infer what might be happening in the population based on the sample data.
What are some examples of descriptive statistics mentioned in the script?
-Examples of descriptive statistics include the mean salary of a random sample of 60 high school teachers and the median rating of a product from a sample of 28 reviewers.
What is the example provided for inferential statistics in the script?
-The example provided for inferential statistics is the mean weekly hours of TV watched by teenagers in the US, which is an estimate based on a sample survey.
Why is it important to be able to apply the definitions learned in the course?
-It is important to apply the definitions because understanding the application helps students to recognize terms and concepts when they encounter them in future weeks of the course and in real-world scenarios.
What does the instructor suggest for students to do with the examples provided?
-The instructor suggests that students read the examples carefully and determine whether the information is a direct result from a sample (descriptive) or if it is being used to estimate or predict something about the larger population (inferential).
Outlines
📚 Introduction to Descriptive and Inferential Statistics
The first paragraph introduces the importance of understanding statistical vocabulary, particularly the distinction between descriptive and inferential statistics. Descriptive statistics involve collecting, organizing, summarizing, and presenting data from a sample, while inferential statistics use sample data to make predictions and draw conclusions about the larger population. The paragraph emphasizes the reliance on random samples to study populations that are too large to analyze in their entirety. It also outlines that statistics include a variety of functions, such as conducting studies, organizing, summarizing, analyzing, and drawing conclusions from data. The speaker encourages students to apply these definitions to examples to reinforce their understanding.
🔍 Analyzing Examples of Descriptive and Inferential Statistics
The second paragraph presents examples to illustrate the concepts of descriptive and inferential statistics. It clarifies that when data is collected and summarized from a sample, it falls under descriptive statistics. Conversely, when sample data is used to estimate or predict outcomes for a larger population, it is considered inferential statistics. The examples given include the mean salary of a sample of high school teachers, the median rating of a burger from a sample of reviewers, an estimated mean of weekly TV hours watched by U.S. teenagers based on a survey, and a predicted population figure for a city in 2030. The paragraph concludes by advising students to read examples carefully to determine whether they are dealing with sample data directly or if the data is being used to infer larger population trends, which would indicate inferential statistics.
Mindmap
Keywords
💡Descriptive Statistics
💡Inferential Statistics
💡Population
💡Sample
💡Data Collection
💡Data Organization
💡Data Summarization
💡Data Analysis
💡Mean
💡Median
💡Estimation
💡Hypothesis Testing
Highlights
The importance of becoming familiar with vocabulary in the first week of the course
Statistics defined as the science of conducting studies to collect, organize, summarize, analyze, and draw conclusions from data
The reliance on samples due to the large size of populations
Descriptive statistics involves collecting, organizing, summarizing, and presenting data from a sample
Inferential statistics uses sample data to make predictions and draw conclusions about the larger population
The key difference between descriptive and inferential statistics lies in whether the data is summarized from a sample or used to infer about the population
Examples are used to apply the definitions of descriptive and inferential statistics
Descriptive statistics specifically implies that a sample is being summarized
Inferential statistics involves estimating or predicting outcomes based on sample data
The median rating of Big Dave's Burger from 28 reviewers is an example of descriptive statistics
The mean weekly hours of TV watched by teenagers in the US is an example of inferential statistics as it estimates a larger population
The population estimate of City A in 2030 is an example of inferential statistics, indicating a prediction
Careful reading of examples is crucial to distinguish between descriptive and inferential statistics
The distinction hinges on whether the data is a direct sample result or an estimate/prediction for the population
Understanding the application of statistical definitions is more important than just learning them
The course does not cover hypothesis tests but they are part of inferential statistics in other programs
The importance of recognizing the source of data (sample or population) to categorize statistics accurately
The video aims to help students with vocabulary and the application of statistical concepts
Transcripts
Browse More Related Video
What is Descriptive Vs. Inferential Statistics?
Descriptive Statistics vs. Inferential Statistics
Descriptive Statistics vs Inferential Statistics | Measure of Central Tendency | Types of Statistics

Descriptive Statistics vs Inferential Statistics
Introduction to Statistics (1.1)

What is Statistics? | Types of Statistics | Descriptive & Inferential Statistics | Acadgild
5.0 / 5 (0 votes)
Thanks for rating: