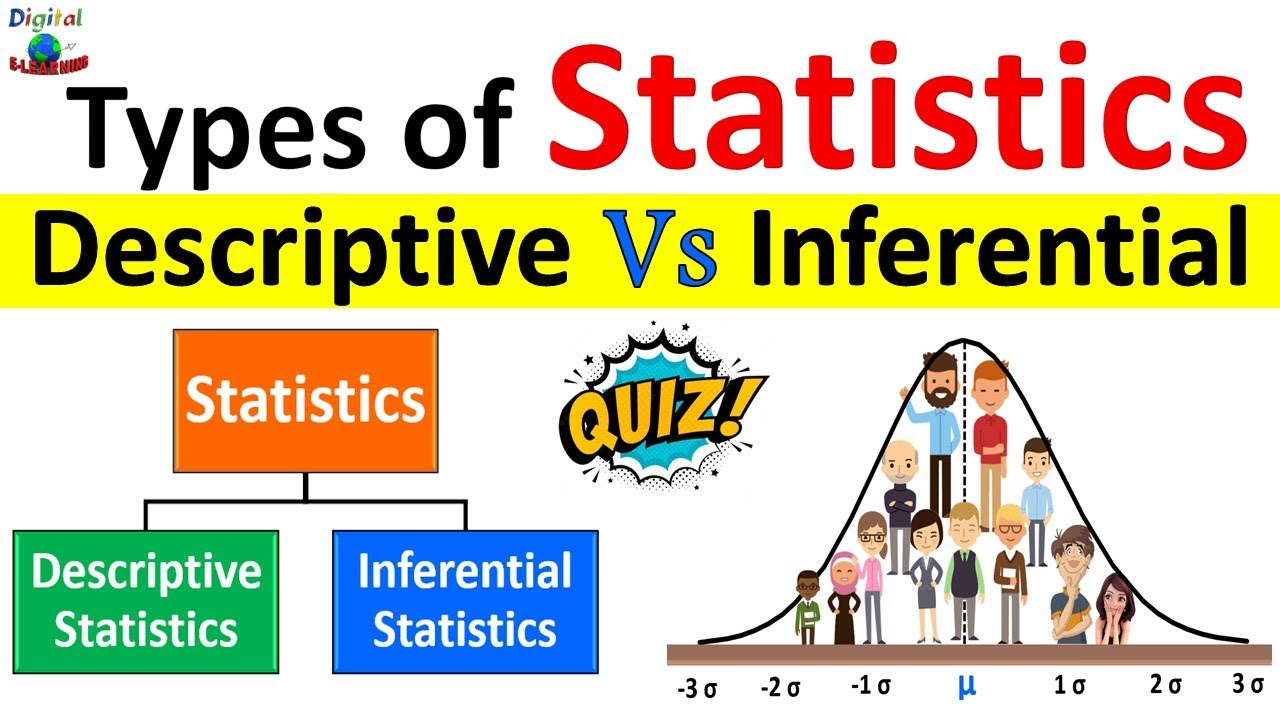
Descriptive Statistics vs. Inferential Statistics
TLDRThis video script delves into the fundamental concepts of descriptive and inferential statistics. Descriptive statistics are used to summarize and quantify the features of a dataset, such as mean, median, mode, and variability measures. In contrast, inferential statistics extend this analysis to make inferences about an entire population based on sample data. Techniques like hypothesis testing and regression analysis are employed to test assumptions and determine relationships between variables, such as the impact of a fertilizer on plant growth or the correlation between height and age.
Takeaways
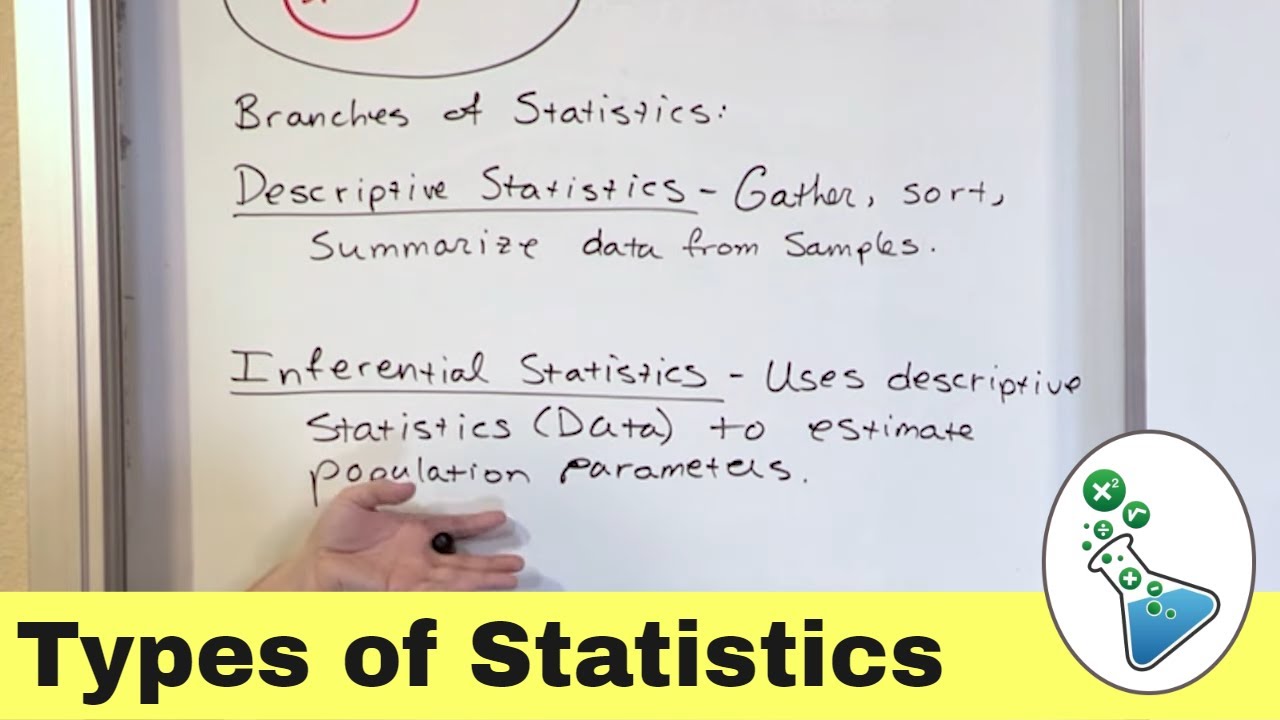
- 📊 Descriptive statistics are used to summarize and organize the features of a dataset quantitatively, such as calculating the mean, median, mode, variance, standard deviation, minimum, and maximum.
- 🔍 Inferential statistics involve using sample data to make inferences about an entire population, going beyond the data at hand to understand the larger context.
- 🌐 A dataset can represent either the entire population or just a sample, which is crucial for understanding the scope of the analysis.
- 🧐 Hypothesis testing is a method in inferential statistics where assumptions about a population are tested using sample data, often involving a null and alternative hypothesis.
- 🌱 An example of hypothesis testing is assessing whether a new fertilizer impacts plant growth, where the null hypothesis suggests no impact and the alternative suggests growth improvement.
- ❌ Rejection of the null hypothesis in hypothesis testing indicates that the tested condition, such as the effectiveness of a fertilizer, has an effect on the outcome.
- 📈 Regression analysis is another technique in inferential statistics that examines the relationship between an independent variable and a dependent variable, like the potential link between age and height.
- 🔑 Descriptive statistics provide a snapshot of the data, focusing on central tendency and variability, while inferential statistics aim to make broader conclusions about a population.
- 📝 The process of hypothesis testing includes formulating an analysis plan, carrying out the plan, analyzing the sample data, and drawing conclusions about the population.
- 🔗 For further information, interested viewers are directed to the website of 'Security Buddy' and a playlist on statistics for machine learning, with links provided in the description.
- 🔔 Viewers are encouraged to subscribe for notifications on recent videos for continued learning on statistics and related topics.
Q & A
What are descriptive statistics?
-Descriptive statistics are used to summarize and organize the main features of a data set quantitatively. They provide measures such as mean, median, mode, variance, standard deviation, minimum, and maximum to describe the data.
What is the purpose of descriptive statistics in analyzing a data set?
-The purpose of descriptive statistics is to provide a concise summary of the data set's features, which helps in understanding the central tendency and variability of the data.
What are inferential statistics?
-Inferential statistics are used to make inferences about a population based on data obtained from a sample. They allow us to draw conclusions and make predictions about the entire population using sample data.
How do inferential statistics differ from descriptive statistics?
-Inferential statistics differ from descriptive statistics in that they are used to make predictions and inferences about a population, whereas descriptive statistics summarize the features of a data set without making inferences.
What is a data set in the context of statistics?
-A data set in the context of statistics refers to a collection of data that is used for analysis. It can represent the entire population or a sample drawn from the population.
Can you explain the concept of hypothesis testing in inferential statistics?
-Hypothesis testing in inferential statistics involves making assumptions about a population and testing these assumptions using sample data. It includes stating a null hypothesis and an alternative hypothesis, formulating an analysis plan, carrying out the plan, and analyzing the sample data to decide whether to reject the null hypothesis.
What is the null hypothesis in hypothesis testing?
-The null hypothesis is a statement of no effect or no difference in hypothesis testing. It is the default assumption that there is no significant relationship between variables being studied.
What is the alternative hypothesis in hypothesis testing?
-The alternative hypothesis is the statement that contradicts the null hypothesis. It suggests that there is an effect or a difference in the variables being studied.
Can you provide an example of how inferential statistics are used in a practical scenario?
-An example of using inferential statistics is in testing the effectiveness of a new fertilizer on plant growth. By applying the fertilizer to a random sample of plants and comparing their growth to a control group, we can infer whether the fertilizer has a significant impact on growth across the entire population of plants.
What is regression analysis and how does it relate to inferential statistics?
-Regression analysis is a statistical method used to examine the relationship between one or more independent variables and a dependent variable. In the context of inferential statistics, it helps to determine whether changes in the independent variable(s) have a significant impact on the dependent variable.
How can regression analysis be used to understand the relationship between height and age of a person?
-Regression analysis can be used to determine if there is a significant relationship between a person's height (dependent variable) and their age (independent variable). By measuring and analyzing data from a sample of individuals, we can infer whether age has an impact on height across the entire population.
Where can interested viewers find more information about statistics for machine learning?
-Interested viewers can find more information about statistics for machine learning on the website of Security Buddy or by referring to the playlist on statistics for machine learning, with relevant links provided in the description of the video.
Outlines
📊 Descriptive vs. Inferential Statistics Overview
This paragraph introduces the fundamental concepts of descriptive and inferential statistics. Descriptive statistics are used to summarize and quantify the features of a dataset, such as mean, median, mode, variance, standard deviation, minimum, and maximum. Inferential statistics, on the other hand, are employed to make inferences about an entire population based on a sample. The paragraph explains that while descriptive statistics help understand a dataset's characteristics, inferential statistics extend this understanding to the broader population, often involving hypothesis testing and regression analysis.
Mindmap
Keywords
💡Descriptive Statistics
💡Inferential Statistics
💡Data Set
💡Central Tendency
💡Variability
💡Sample
💡Population
💡Hypothesis Testing
💡Null Hypothesis
💡Alternative Hypothesis
💡Regression Analysis
Highlights
Descriptive statistics are used to summarize and quantify the features of a dataset.
Inferential statistics are used to make inferences about an entire population based on a sample.
Descriptive statistics include measures like mean, median, mode, variance, standard deviation, minimum, and maximum.
Inferential statistics often involves hypothesis testing and regression analysis.
A data set can represent the entire population or just a sample.
Hypothesis testing involves stating null and alternative hypotheses to test assumptions about the population.
The null hypothesis assumes no effect or relationship, while the alternative hypothesis suggests an effect or relationship.
An analysis plan is formulated and executed to test the hypotheses using sample data.
The results of hypothesis testing lead to a decision to either reject or fail to reject the null hypothesis.
Rejection of the null hypothesis indicates a significant impact or effect on the variable of interest.
Regression analysis in inferential statistics examines the impact of independent variables on a dependent variable.
An example of regression analysis is determining if a person's height is related to their age.
Descriptive statistics provide a quantitative summary of a dataset's characteristics.
Inferential statistics allow for broader conclusions about a population based on sample data.
The video explains the practical applications of both descriptive and inferential statistics with examples.
For more information, viewers are directed to the Security Buddy website and statistics for machine learning playlist.
Subscribers can stay updated with notifications on recent videos.
Transcripts
Browse More Related Video
Descriptive Statistics vs Inferential Statistics | Measure of Central Tendency | Types of Statistics

Introduction to Descriptive Statistics
What is Descriptive Vs. Inferential Statistics?
Descriptive vs Inferential Statistics

Math 119 Chapter 3 intro
Inferential Statistics FULL Tutorial: T-Test, ANOVA, Chi-Square, Correlation & Regression Analysis
5.0 / 5 (0 votes)
Thanks for rating: