Math 119 Chapter 3 intro
TLDRThis video script introduces Chapter Three, focusing on basic statistics and numeric calculations that describe data characteristics. It differentiates between descriptive statistics, which summarize data visually and numerically, and inferential statistics, which make predictions about populations based on sample data. The script emphasizes the importance of the mean as a measure of central value, while also noting its sensitivity to outliers and skewness, suggesting the median as an alternative in such cases. The video promises to cover hypothesis testing and confidence intervals in subsequent parts.
Takeaways
- 📚 The video discusses Chapter Three, which is divided into two parts, focusing on basic statistics and numeric calculations for data description.
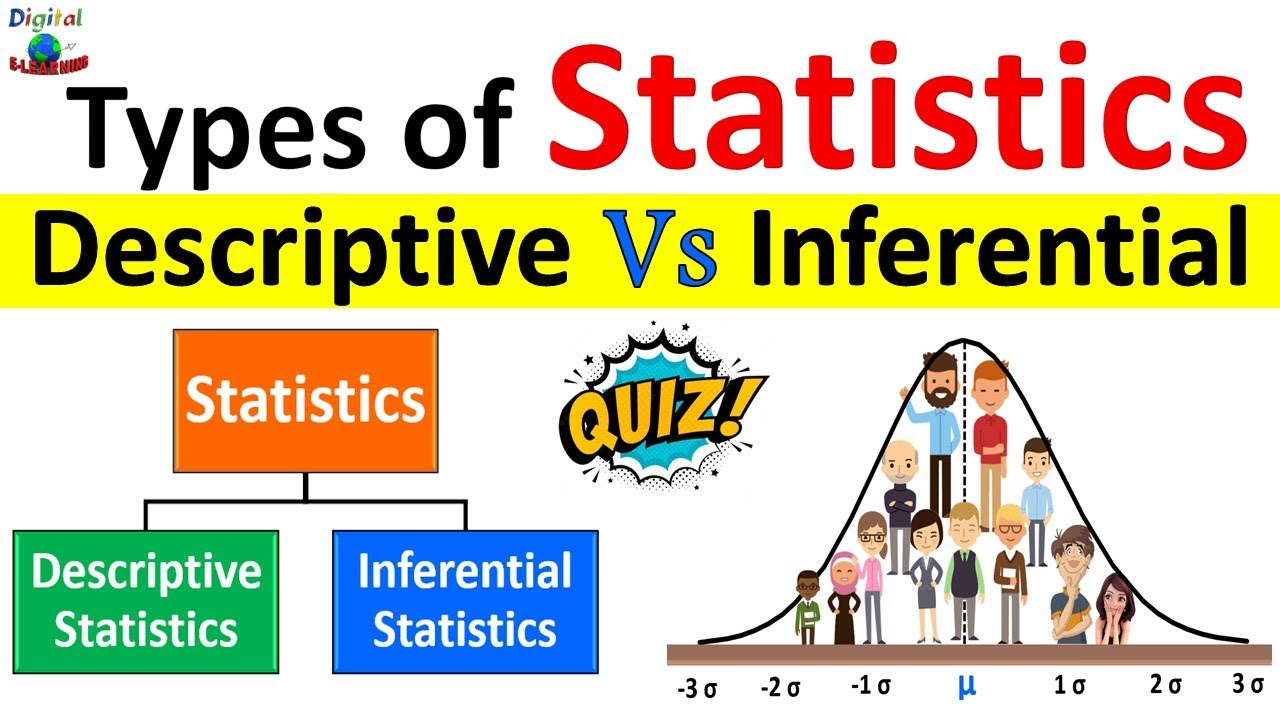
- 📊 Descriptive statistics are introduced as a method to summarize data using charts, graphs, tables, and numerical calculations, similar to the work done in Chapter Two.
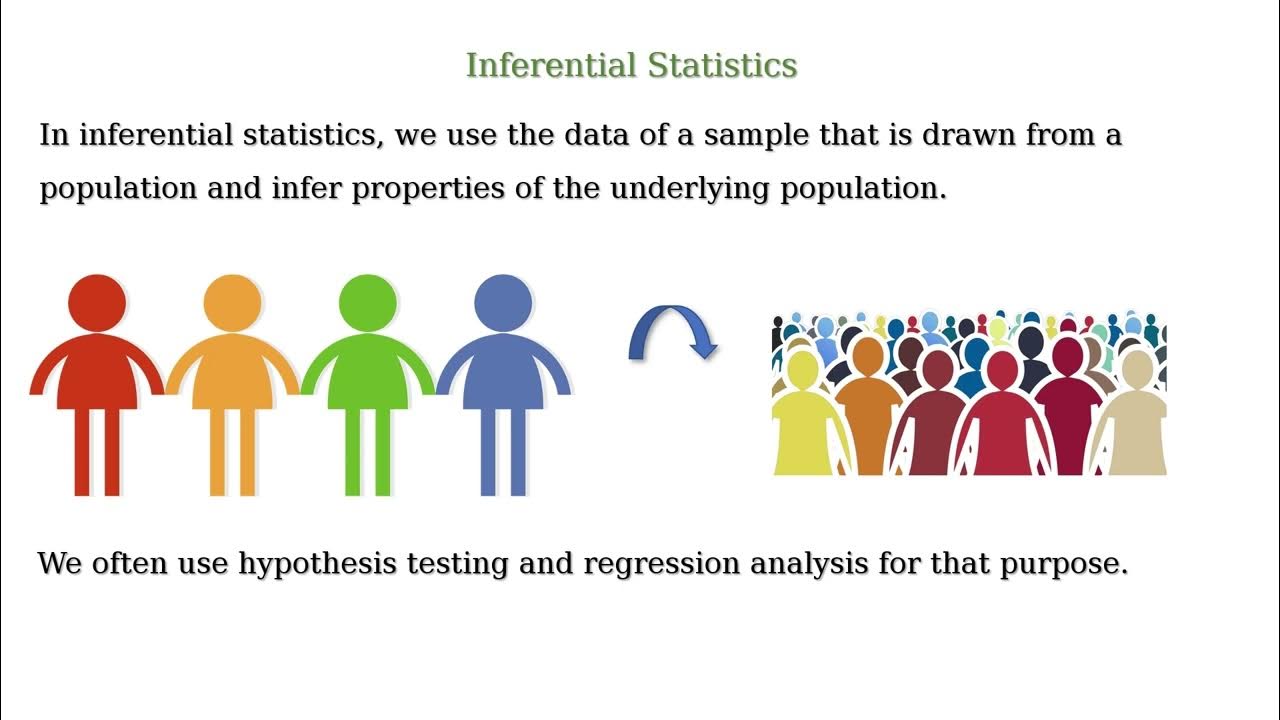
- 🔍 Inferential statistics are highlighted as a powerful tool used for making predictions about populations based on sample data, though they come with a margin of error.
- 🧐 The script mentions that it's rare to be 100% certain when using inferential statistics, often resulting in confidence levels like 90% or 95%.
- 📈 The concept of 'measure of center' is introduced, emphasizing the importance of the mean as a central value of the data set.
- 🔢 The formula for calculating the mean (both sample mean 'x bar' and population mean 'mu') is explained, involving the sum of all values divided by the number of values.
- 📉 The mean is noted to be influenced by skewness and sensitive to outliers, making it less appropriate as a measure of center in such cases.
- 🏔️ The median is suggested as an alternative measure of center when dealing with outliers or skewed data, as it is more resistant to these influences.
- 📚 The speaker shares a personal anecdote about using the median instead of the mean when grading tests to avoid distortion caused by outliers.
- 📉 The script points out that the mean can be significantly lower than the median in the presence of outliers, impacting the perception of performance.
- 📊 The importance of understanding data distribution, such as normal or skewed, is emphasized to choose the appropriate measure of center.
Q & A
What will be covered in Chapter Three of the video series?
-Chapter Three will cover basic statistics and numeric calculations used to describe important characteristics of a set of data, focusing on two types of statistics: descriptive statistics and inferential statistics.
What is the purpose of descriptive statistics?
-Descriptive statistics involve summarizing or describing data with charts, graphs, tables, and numerical calculations to provide a clear picture of the data set.
How are inferential statistics different from descriptive statistics?
-Inferential statistics use sample data to make inferences about populations, allowing for predictions and insights into the larger population based on the sample.
Why is inferential statistics considered a powerful tool in society?
-Inferential statistics is powerful because it enables predictions about population data based on sample data, which is time-saving and efficient.
What is a measure of center in statistics?
-A measure of center is a number that represents the central value of the data, such as the mean or median.
What is the formula for calculating the mean (average) of a data set?
-The mean is calculated by adding up all the values in the data set and dividing by the number of values.
What are the symbols used to represent the sample mean and population mean?
-The sample mean is represented by 'x bar' and the population mean is represented by the Greek letter 'mu' (μ).
Why might the mean not be an appropriate measure of center for a data set?
-The mean is not appropriate when the data is skewed or contains outliers, as it is sensitive to these and can be influenced by them.
What is the alternative to the mean when dealing with outliers in a data set?
-The median is often used as an alternative to the mean when dealing with outliers, as it is less sensitive to the influence of extreme values.
Why might the median be a better measure of central tendency than the mean for skewed data?
-The median is less affected by skewness and outliers, providing a more accurate representation of the center of the data when the distribution is not symmetric.
How does the speaker use the median to decide whether to curve an exam?
-The speaker looks at the median instead of the mean to determine if the exam should be curved, as the median is less influenced by outliers and provides a better reflection of the typical student's performance.
Outlines
📚 Introduction to Chapter Three: Statistics
The script introduces the first part of Chapter Three, which will be covered in two videos. It discusses the importance of basic statistics for describing data characteristics through numeric calculations. Two types of statistics are highlighted: descriptive statistics, which summarize data using visual and numerical methods, and inferential statistics, which make predictions about populations based on sample data. The script emphasizes the power and efficiency of statistics in society, while also noting the inherent uncertainties and margins of error associated with inferential statistics, such as the use of hypothesis testing and confidence intervals.
Mindmap
Keywords
💡Descriptive Statistics
💡Inferential Statistics
💡Measure of Center
💡Mean
💡Median
💡Skewness
💡Outliers
💡Margin of Error
💡Hypothesis Testing
💡Confidence Intervals
💡Population vs. Sample
Highlights
Introduction to Chapter Three, discussing basic statistics and numeric calculations.
Descriptive statistics explained, involving summarizing data with visual and numerical methods.
Inferential statistics introduced, using sample data to make predictions about populations.
The importance of statistics in society for making predictions based on sample data.
The concept of certainty in inferential statistics, often not reaching 100% due to margins of error.
Introduction to hypothesis testing and confidence intervals as part of inferential statistics.
Definition and calculation of the mean as a measure of central value in data sets.
Differentiation between sample mean (x bar) and population mean (mu).
The influence of skewness and outliers on the mean, affecting its appropriateness as a measure of center.
The median as an alternative measure of center when dealing with outliers or skewed data.
The use of median in grading tests to avoid distortion caused by outliers.
The difference between mean and median in representing class performance, with median sometimes being higher.
The suitability of the mean for symmetric data distributions, like normal distributions.
The impact of skewness on the mean and its potential issues in data representation.
The importance of understanding the center of data for making informed decisions.
Anecdotal example of the American League in 2001 to illustrate the application of statistics.
Transcripts
Browse More Related Video
Descriptive Statistics vs Inferential Statistics | Measure of Central Tendency | Types of Statistics

Descriptive Statistics [Simply explained]
Descriptive Statistics vs. Inferential Statistics

Descriptive Statistics vs Inferential Statistics

Introduction to Descriptive Statistics
Probability and Statistics Made Easy: Essential for Data Scientists
5.0 / 5 (0 votes)
Thanks for rating: