Quantitative Data - Why ? What? || Interval Data || Ratio Data || Statistics for Beginners
TLDRThis video script delves into quantitative data, explaining its nature as numerical data that allows for arithmetic operations. It distinguishes between interval and ratio data, highlighting their properties like rank, order, and meaningful zeros. The script illustrates how interval data, such as temperature, lacks a true zero, while ratio data, like distance, has one, enabling operations like multiplication and division. It concludes by discussing statistical measures applicable to both types of data, aiming to clarify concepts for viewers.
Takeaways
- 📊 Quantitative data is numerical and can be measured using instruments like scales, rulers, and thermometers.
- 🔢 It is distinct from qualitative data and is also known as numerical data, representing quantities such as weight, temperature, or distance.
- 📈 Quantitative data is categorized into two types: Interval and Ratio, each with specific properties and characteristics.
- 🌡️ Interval data is measured numerically and has a rank and order, with equidistant intervals, but lacks a meaningful zero.
- ❄️ Examples of interval data include temperature in Celsius or Fahrenheit, dates, and the IQ scale, where negative values are possible.
- ✅ Interval data allows for grouping, sorting, and basic arithmetic operations like addition and subtraction, but not multiplication or division due to the absence of a meaningful zero.
- 📏 Ratio data, unlike interval data, has a meaningful zero, indicating the absence of a quantity, and cannot be negative.
- 🏃♂️ Ratio data examples include distance traveled, age, and weight, where a meaningful zero is present, signifying no quantity.
- 🔄 Operations on ratio data include grouping, sorting, addition, subtraction, multiplication, and division, due to the meaningful zero.
- 📊 Both interval and ratio data allow for the calculation of central tendencies like mean, median, or mode, and measures of spread such as range, standard deviation, or variance.
- 💬 The video encourages viewers to engage with the content by sharing thoughts or questions in the comments section and subscribing for more informative videos.
Q & A
What is quantitative data?
-Quantitative data refers to data that can be measured in the form of numbers, allowing for arithmetic operations to be performed on it. It is also known as numerical data.
How is quantitative data measured?
-Quantitative data is measured using various instruments such as weighing machines, rulers, measuring tapes, stopwatches, thermometers, etc.
What are the two main types of quantitative data?
-The two main types of quantitative data are interval data and ratio data.
What are the four properties of interval data?
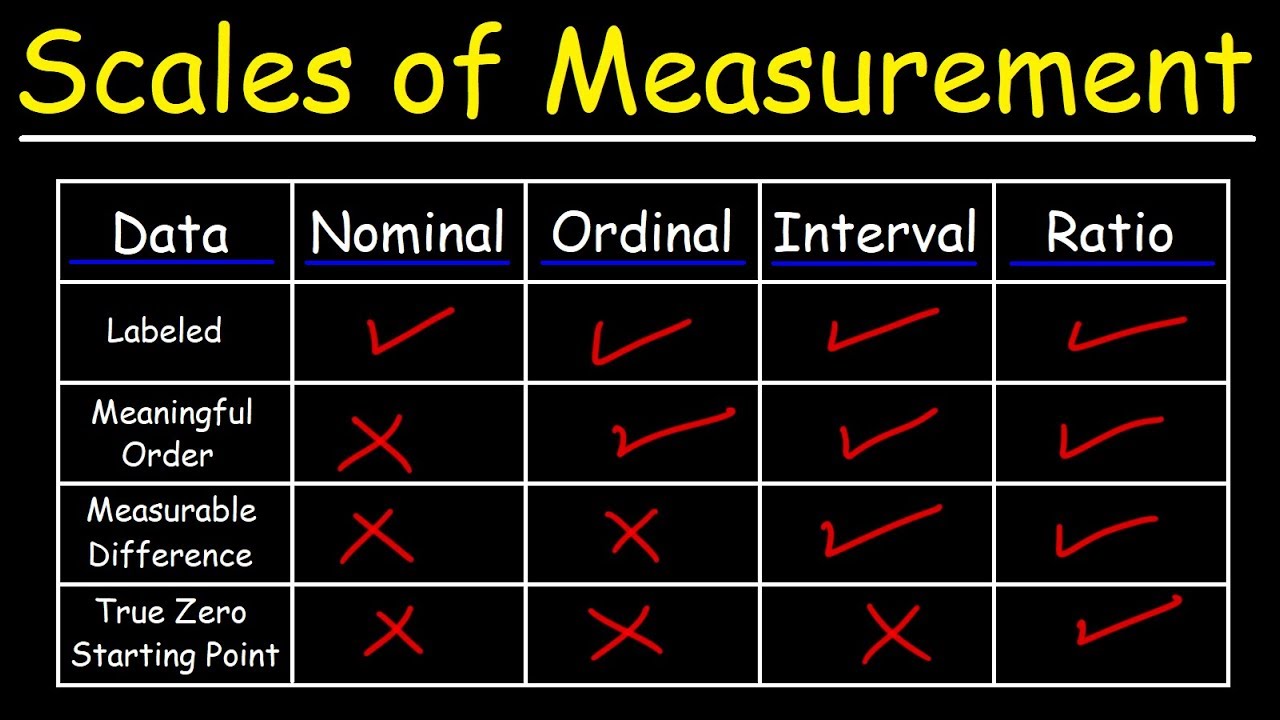
-The four properties of interval data are: 1) It is measured in numbers, 2) It has rank and order, 3) It is equidistant with equally spaced intervals, and 4) It does not have a meaningful zero.
Can you provide an example of interval data?
-Examples of interval data include temperature in Celsius or Fahrenheit, dates, and the IQ scale, all of which do not have a meaningful zero.
What mathematical operations can be performed on interval data?
-On interval data, you can perform grouping using equal to and not equal to operators, sorting, and addition and subtraction. However, multiplication and division are not applicable due to the lack of a meaningful zero.
What distinguishes ratio data from interval data?
-Ratio data has all the properties of interval data but also includes a meaningful zero, which allows for operations such as multiplication and division.
Give an example of ratio data and explain its properties.
-Examples of ratio data include distance traveled, age, and weight. These have a meaningful zero (e.g., 0 km traveled) and cannot be negative, unlike interval data.
What are the mathematical operations that can be performed on ratio data?
-Ratio data allows for grouping, sorting, addition, subtraction, multiplication, and division due to the presence of a meaningful zero.
How can the central point of a data set be determined using quantitative data?
-The central point of a data set can be determined using measures such as mean, median, or mode for both interval and ratio data.
What statistical measures can be used to describe the spread of quantitative data?
-The spread of quantitative data can be described using range, standard deviation, or variance.
Outlines
📊 Introduction to Quantitative Data
This paragraph introduces the topic of the video, which is Quantitative Data. It distinguishes between Qualitative and Quantitative data, noting that the former was covered in a previous video. Quantitative data is described as numerical and measurable, allowing for arithmetic operations. Examples of Quantitative data include student weights, temperatures, and distances between cities. The paragraph also sets up the structure for the rest of the video, promising a detailed discussion on the types of Quantitative data, specifically Interval and Ratio data.
Mindmap
Keywords
💡Quantitative data
💡Qualitative data
💡Interval data
💡Ratio data
💡Arithmetic operations
💡Measuring instruments
💡Equidistant intervals
💡Meaningful zero
Highlights
Quantitative data is defined as data that represents quantities and can be measured in the form of numbers, allowing for arithmetic operations.
Quantitative data is also known as numerical data and can be measured using instruments like weighing machines, rulers, and thermometers.
The video discusses two types of quantitative data: Interval and Ratio data.
Interval data has four properties: numerical measurement, rank and order, equidistant intervals, and no meaningful zero.
Examples of interval data include temperature in Celsius or Fahrenheit, dates, and the IQ scale.
Interval data allows for grouping, sorting, and basic arithmetic operations but does not support multiplication or division due to the lack of a meaningful zero.
Ratio data also has four properties, similar to interval data, but includes a meaningful zero and cannot be negative.
Examples of ratio data include distance traveled, age, and weight, all of which have a meaningful zero.
Ratio data supports all basic arithmetic operations, including multiplication and division, due to the presence of a meaningful zero.
Both interval and ratio data can be analyzed for central tendencies such as mean, median, and mode, as well as range, standard deviation, and variance.
The video provides a clear explanation of the differences between interval and ratio data, emphasizing the importance of the meaningful zero.
The video is aimed at educating viewers on the concepts and applications of quantitative data in statistics.
The presenter encourages viewers to subscribe for more informative videos on similar topics.
The video concludes with an invitation for viewers to share their thoughts or questions in the comment section.
The video provides a comprehensive overview of quantitative data, suitable for those interested in statistics and data analysis.
The video's content is structured to progressively build understanding from basic concepts to more complex数据分析.
The video uses practical examples to illustrate the concepts of interval and ratio data, enhancing viewer comprehension.
The video emphasizes the importance of understanding data types for accurate statistical analysis and decision-making.
Transcripts
Browse More Related Video
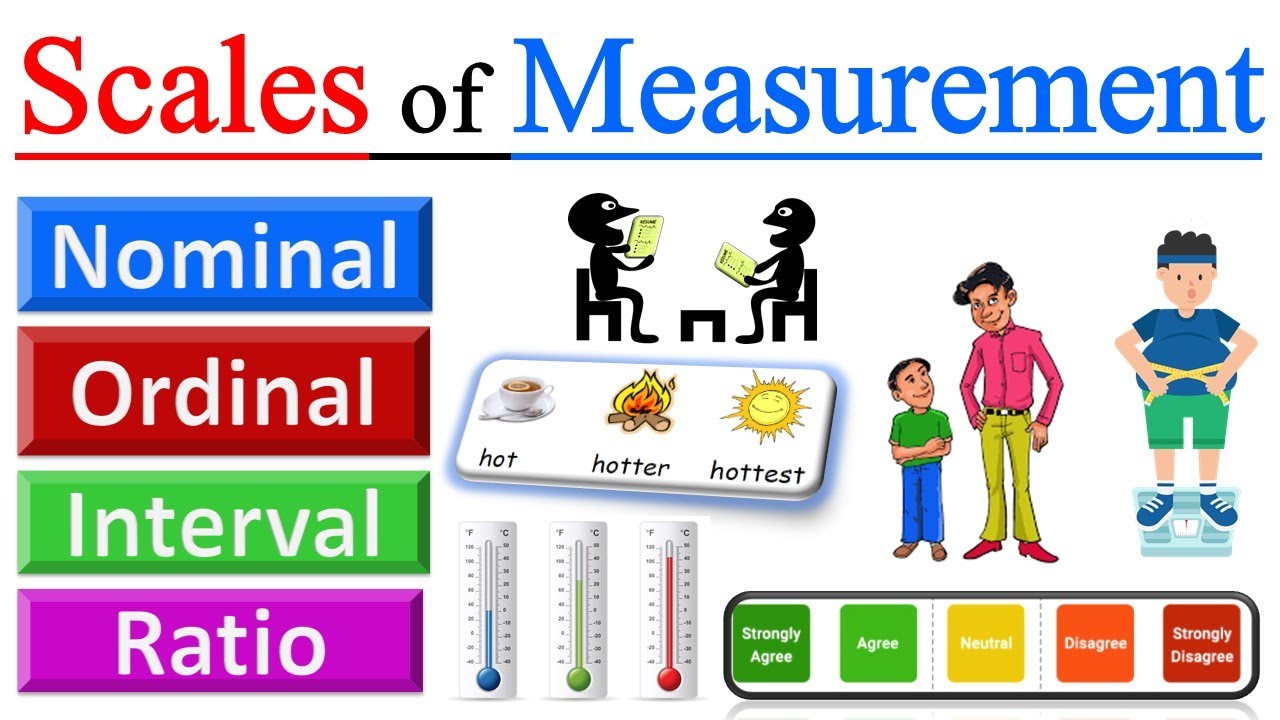
Scales of Measurement in Statistics - Nominal, Ordinal, Interval, Ratio | Level of Measurement

Nominal, Ordinal, Interval & Ratio Data: Simple Explanation With Examples
Scales of Measurement - Nominal, Ordinal, Interval, & Ratio Scale Data
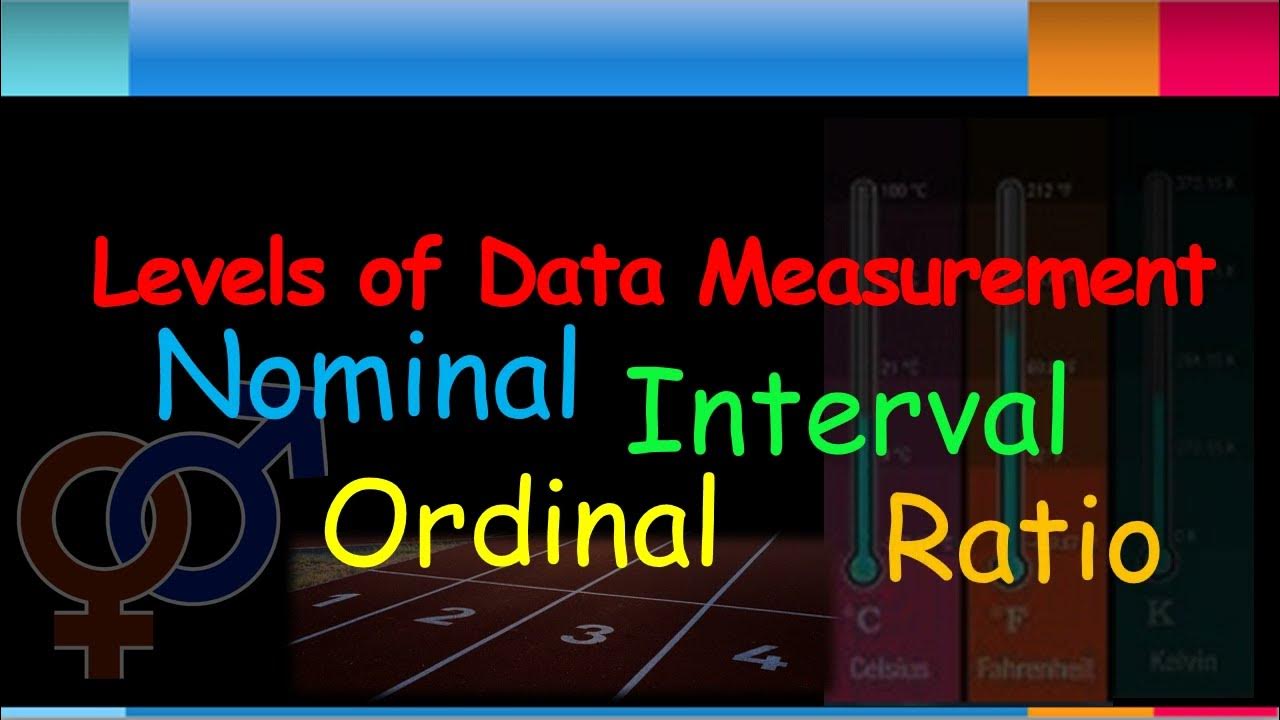
Data Types - Levels of Data Measurements - Nominal Ordinal Interval Ratio | Statistics | Research
Introduction to Levels of Measurement: Nominal, Ordinal, Interval, Ratio
Classification of Variables and Types of Measurement Scales
5.0 / 5 (0 votes)
Thanks for rating: