Nominal, Ordinal, Interval & Ratio Data: Simple Explanation With Examples
TLDRThis video script offers a clear explanation of the four levels of measurement in statistics: nominal, ordinal, interval, and ratio. It distinguishes between categorical and numerical data, emphasizing the importance of data type in selecting appropriate statistical tests. Nominal data categorizes without rank, ordinal introduces order, interval ensures equal intervals between data points but lacks a true zero, and ratio includes a meaningful zero, allowing for more complex statistical analysis. The script simplifies these concepts with practical examples, aiming to boost confidence in data analysis for academic research and projects.
Takeaways
- 📊 The script introduces four levels of measurement in statistics: nominal, ordinal, interval, and ratio.
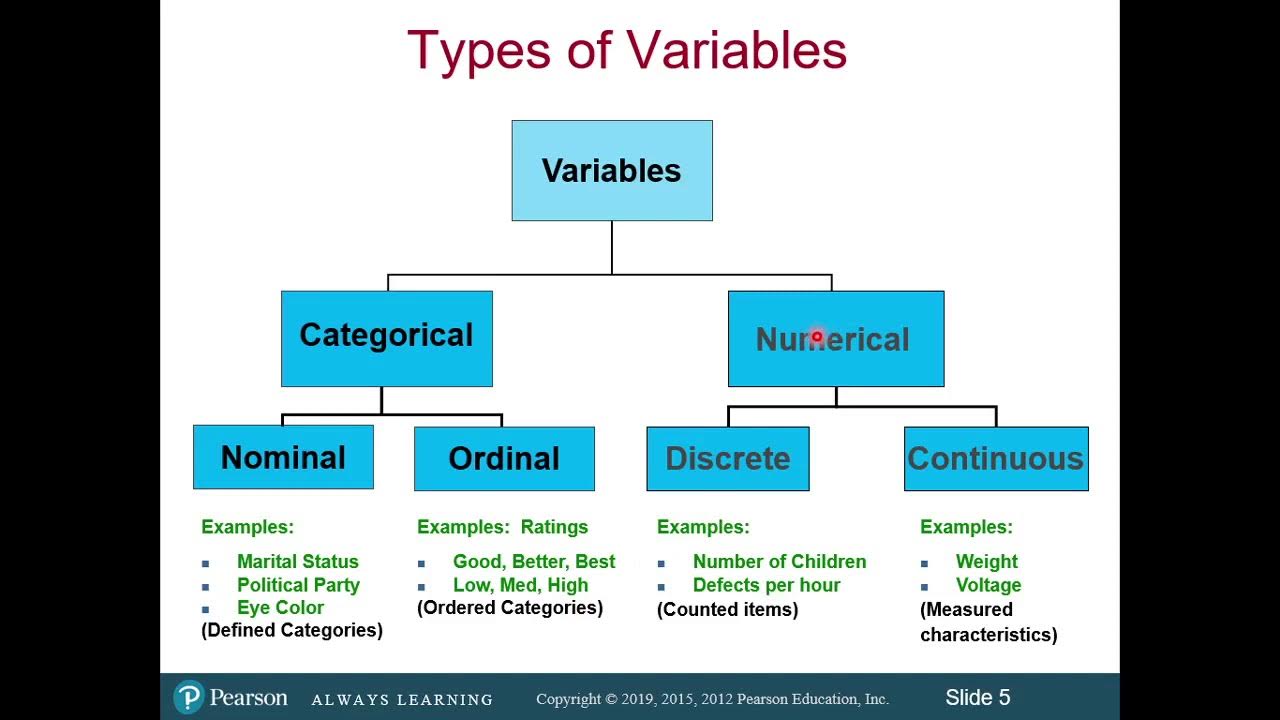
- 🔍 Categorical and numerical data are the two main types of data, with categorical being qualitative and numerical being quantitative.
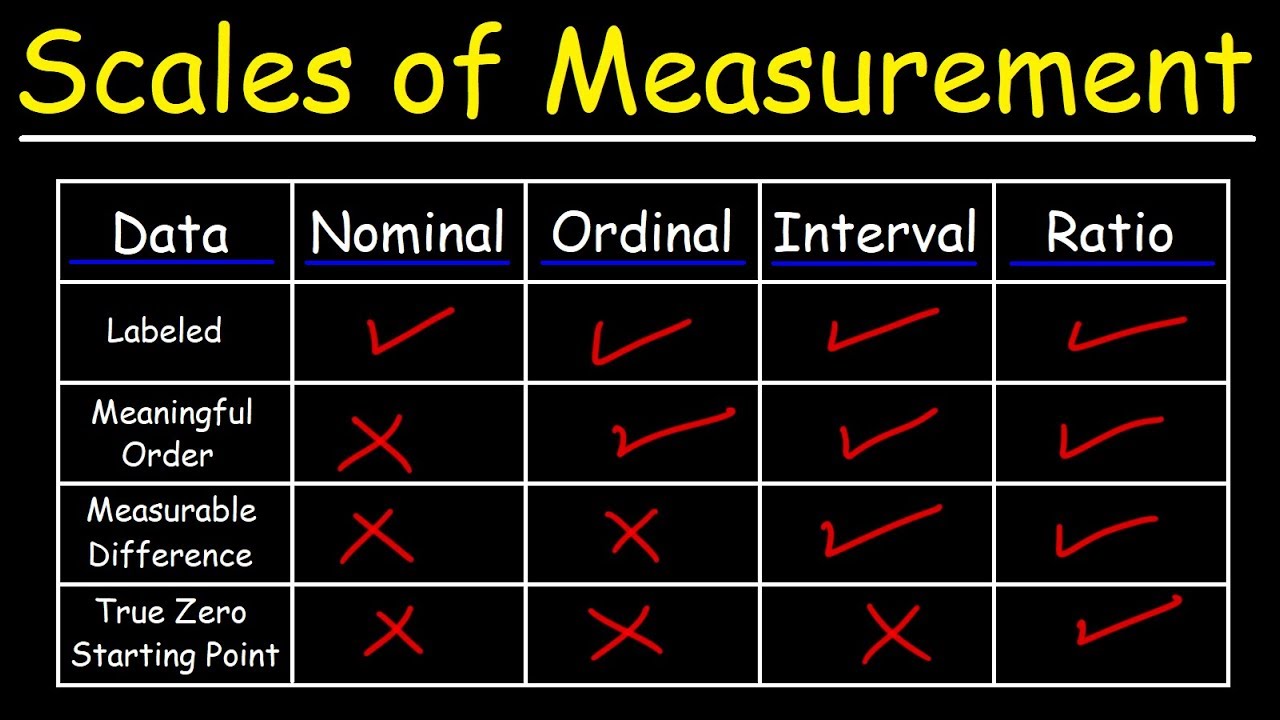
- 🏷 Nominal data, a type of categorical data, represents categories without inherent numerical value or rank, such as gender or ethnicity.
- 📊 Ordinal data, another categorical type, has categories with a meaningful order or rank, like levels of income or satisfaction.
- ♨️ Interval data is numerical and has equal spaces between measurement points, but lacks a meaningful zero point, exemplified by credit scores or Fahrenheit temperatures.
- 🎯 Ratio data is the most sophisticated level, with ordered numerical values, equal distances between points, and a meaningful zero point, like weight or height.
- 🚫 The level of data measurement determines which statistical tests can be used, as applying the wrong test to a data set can yield meaningless results.
- 📝 Understanding the level of data is crucial for proper data analysis and interpretation in research.
- 🔑 Nominal data is useful for comparing basic demographic information and assessing statistically significant differences among categories.
- 📉 Ordinal data allows for the ranking of categories but does not permit the calculation of numerical differences between them.
- 🌡️ Interval data, despite having equal intervals, cannot be used to determine ratios or multiplicative comparisons due to the arbitrary zero point.
- ⏱️ Ratio data's absolute zero point enables meaningful comparisons of ratios and multiplicative relationships, expanding the range of statistical tests that can be applied.
Q & A
What are the four levels of measurement in statistics mentioned in the video?
-The four levels of measurement in statistics are nominal, ordinal, interval, and ratio.
What is the difference between categorical and numerical data?
-Categorical data reflect characteristics or categories and are qualitative, such as gender or ethnicity. Numerical data are inherently numbers based and quantitative, like age, height, or weight.
Why is it important to distinguish between different levels of data measurement?
-It's important because the level of measurement for any set of data will directly impact which statistical tests can be used on it, ensuring meaningful results.
What type of data is considered nominal and why?
-Nominal data is a categorical data type that describes qualitative characteristics or groups with no inherent numerical value, order, or rank between categories, such as gender or blood type.
Can you provide an example of ordinal level data?
-Examples of ordinal level data include income levels (low, medium, high), levels of agreement (disagree, neutral, agree), and levels of satisfaction (poor, average, good, excellent).
What is unique about interval level data compared to ordinal data?
-Interval level data, unlike ordinal data, have equal spaces between measurement points but do not have a meaningful zero point, such as credit scores or Fahrenheit temperatures.
How does ratio level data differ from interval level data?
-Ratio level data, like interval data, are ordered and the numerical distance between points is consistent. However, ratio data have an absolute meaningful zero point, such as weight, height, or Kelvin temperature.
What does it mean for data to have a 'meaningful zero point'?
-A 'meaningful zero point' means that a zero value represents an absence of the quantity being measured, like zero weight meaning weightlessness or zero Kelvin indicating absolute zero heat.
Why are statistical tests limited to certain levels of data?
-Statistical tests are limited to certain levels of data because they are designed to work with specific characteristics of the data, such as order, equal intervals, and meaningful zeros.
What is the significance of understanding the level of measurement before conducting statistical analysis?
-Understanding the level of measurement is crucial for selecting the appropriate statistical tests, which in turn ensures the validity and reliability of the analysis and its results.
How can nominal level data still be useful in research?
-Nominal level data can be useful for comparing responses among basic demographic dimensions, such as assessing statistically significant differences in responses between different genders or ethnicities.
What is the role of the zero point in interval and ratio level data?
-In interval level data, the zero point is arbitrary and does not represent an absence of the measured quantity. In contrast, in ratio level data, the zero point is absolute and meaningful, indicating the absence of the quantity.
Outlines
📊 Introduction to Data Measurement Levels
This paragraph introduces the four levels of measurement in statistics: nominal, ordinal, interval, and ratio. It explains the importance of understanding these levels for selecting appropriate statistical tests and emphasizes the distinction between categorical and numerical data. Categorical data is further divided into nominal (no inherent order) and ordinal (with a meaningful order), while numerical data includes interval (equal spaces between points but arbitrary zero) and ratio (equal spaces and a meaningful zero). The paragraph sets the stage for a deeper dive into each level with examples to follow.
🔢 Understanding Categorical and Numerical Data
This paragraph delves into the specifics of categorical and numerical data, highlighting the differences between nominal and ordinal data within the categorical category. Nominal data are used to classify without any inherent order, such as gender or ethnicity. Ordinal data, on the other hand, involve categories that have a clear ranking, like income levels or levels of satisfaction. The paragraph also introduces interval and ratio data as numerical levels of measurement, with interval data having equal intervals between values but an arbitrary zero, and ratio data having both equal intervals and a meaningful zero, which allows for more sophisticated statistical analysis.
📈 Recap and Further Resources
The final paragraph provides a recap of the different levels of data measurement, summarizing the key characteristics of nominal, ordinal, interval, and ratio data. It also clarifies that numerical data are continuous and, in the context of SPSS, are referred to as scale data. The paragraph concludes by encouraging viewers to engage with the content through likes and comments and to subscribe for more research-related advice. Additionally, it offers a private coaching service for those seeking personalized support throughout their research process, with a link provided for more information.
Mindmap
Keywords
💡Levels of Measurement
💡Categorical Data
💡Nominal Data
💡Ordinal Data
💡Numerical Data
💡Interval Data
💡Ratio Data
💡Statistical Tests
💡Meaningful Zero Point
💡Continuous Data
💡SPSS
Highlights
The video explains the four levels of measurement in statistics: nominal, ordinal, interval, and ratio.
Categorical and numerical data are the two main types of data, reflecting different levels of measurement.
Categorical data assigns number values to qualitative data, such as gender or hair color.
Numerical data is inherently quantitative, like age, height, or weight.
The level of measurement impacts which statistical tests can be used.
Nominal data describes categories with no inherent rank or order, such as ethnicity or favorite color.
Ordinal data has a meaningful order or rank, like income levels or levels of agreement.
Interval data has equal spaces between measurement points and an order, but no meaningful zero point.
Examples of interval data include credit scores, GMAT scores, and Fahrenheit temperatures.
Ratio data is the most sophisticated level, with a meaningful zero point and consistent numerical distance.
Ratio data includes measurements like weight, height, and time, where zero has a meaningful value.
Numerical data, both interval and ratio, are continuous data types.
In SPSS, numerical data is referred to as scale data, covering both interval and ratio levels.
The video provides practical examples to help understand each level of measurement.
Understanding data levels is crucial for selecting appropriate statistical tests.
The video offers actionable advice for academic research and dissertations.
Free chapter templates are available to fast-track research projects.
Transcripts
Browse More Related Video
Data Types - Levels of Data Measurements - Nominal Ordinal Interval Ratio | Statistics | Research
Scales of Measurement - Nominal, Ordinal, Interval, Ratio (Part 2) - Introductory Statistics
Scales of Measurement - Nominal, Ordinal, Interval, & Ratio Scale Data
Introduction to Levels of Measurement: Nominal, Ordinal, Interval, Ratio
Classification of Variables and Types of Measurement Scales
Types of Data: Nominal, Ordinal, Interval/Ratio - Statistics Help
5.0 / 5 (0 votes)
Thanks for rating: