Scales of Measurement in Statistics - Nominal, Ordinal, Interval, Ratio | Level of Measurement
TLDRThis video script delves into the nuances of data measurement, explaining the four levels of measurement: nominal, ordinal, interval, and ratio. It clarifies how data is categorized into quantitative (discrete and continuous) and qualitative (categorical) types. The script provides examples to illustrate each level, such as smartphone brand preferences for nominal data, temperature for interval, and height for ratio. It also outlines the statistical implications of each level, including the types of statistical tests applicable and the operations that can be performed on the data, like addition, subtraction, multiplication, and division. The video concludes with interactive questions to test viewers' understanding of the measurement levels.
Takeaways
- 📊 Data is a collection of facts or information used for analysis and decision-making.
- 🔍 Primary data is real-time, first-hand data collected through surveys, questionnaires, experiments, observations, or interviews.
- 📚 Secondary data uses already available information from sources like books, journals, browsers, or online research.
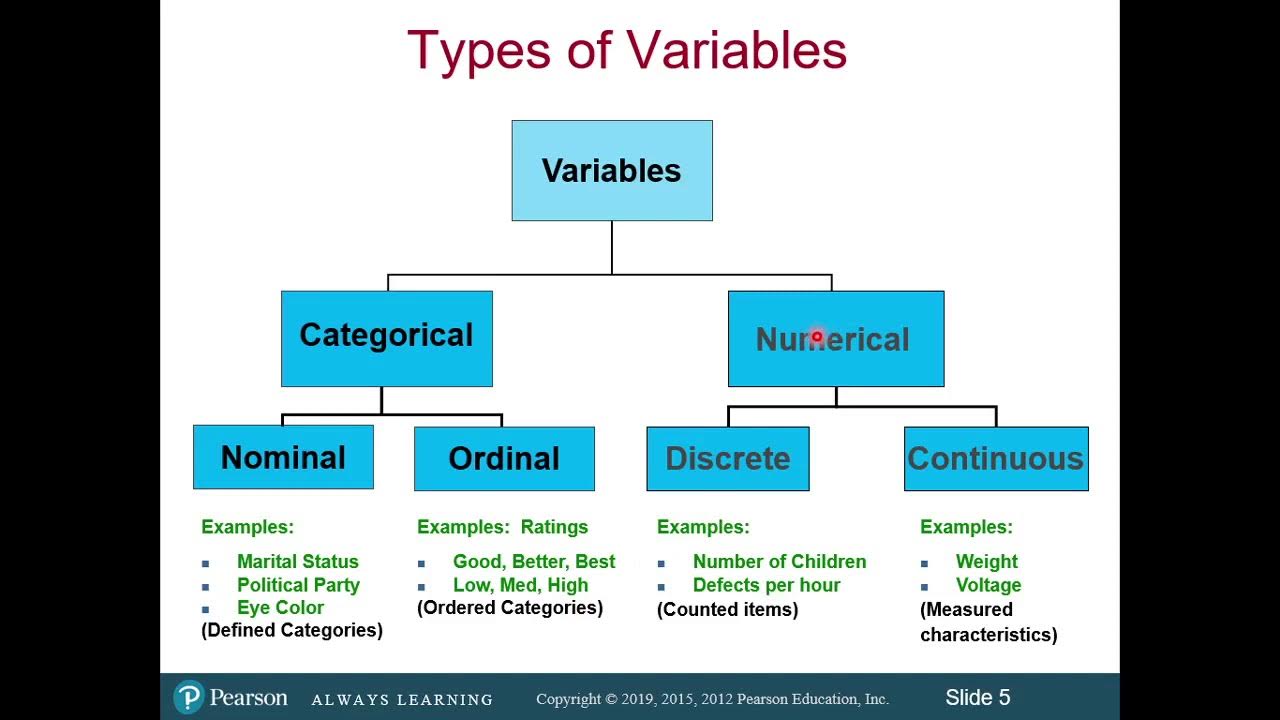
- 📈 Data can be classified into quantitative (discrete and continuous) and qualitative (categorical) categories.
- 🔢 Discrete data takes whole numbers that cannot be meaningfully subdivided (e.g., number of students in a class).
- 🌡️ Continuous data can be measured and takes any value within a range (e.g., temperature).
- 🏷️ Qualitative data is categorical and can be divided into categories without a specific order (e.g., male and female).
- 📏 In statistics, there are four levels of measurement: nominal, ordinal, interval, and ratio.
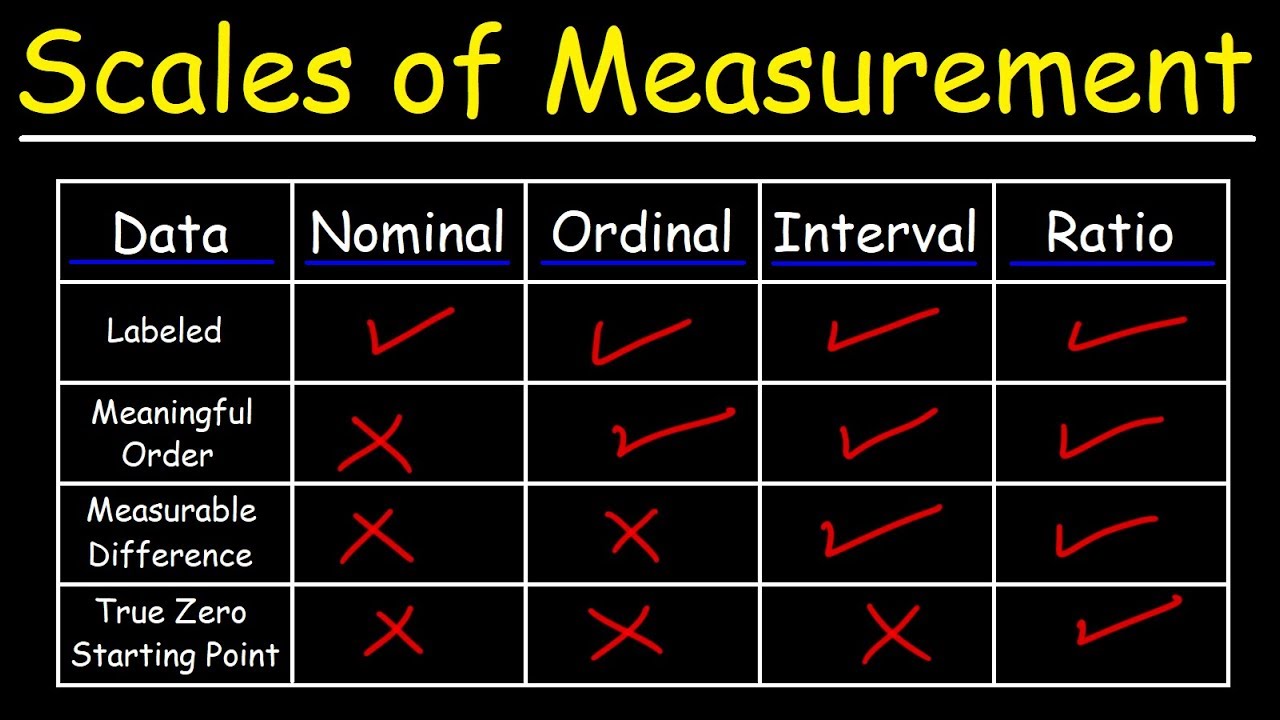
- 📜 Nominal scale is a naming scale where variables are simply named or labeled without any specific order (e.g., types of pets).
- 🔢 Ordinal scale follows a natural order but the difference between values is not known (e.g., satisfaction ratings).
- 📊 Interval scale includes order and exact difference between values but lacks a true zero (e.g., Celsius temperature).
- 📏 Ratio scale includes order, exact difference between values, and an absolute zero (e.g., height, weight).
- 📊 Measures of central tendency differ across scales: nominal (mode), ordinal (mode, median), interval (mode, median, mean), and ratio (mode, median, mean, geometric mean).
- ⚖️ Absolute zero is possible only in the ratio scale, not in nominal, ordinal, or interval scales.
Q & A
What is data according to the video?
-Data is a collection of facts such as values of measurements or information that can be used for analysis and making decisions about certain business aspects like sales or targets.
What are the two main sources of data mentioned?
-The two main sources of data mentioned are primary data and secondary data.
What is the difference between primary data and secondary data?
-Primary data is real-time, first-hand data collected from surveys, questionnaires, experiments, observations, or interviews. Secondary data is information that is already available, such as from books, journals, browsers, or online sources like Google.
How is data classified broadly?
-Data is broadly classified into two categories: quantitative data and qualitative data.
What are the two types of quantitative data?
-The two types of quantitative data are discrete data and continuous data.
Can you give examples of discrete data and continuous data?
-Discrete data examples include the number of students in a class or the number of heads on a coin. Continuous data examples include measurements like weight (e.g., 27.75 kg) or temperature.
What is qualitative data and how is it categorized?
-Qualitative data is categorical data that can be divided into categories such as male and female, or types and colors of objects.
What are the four levels of measurement in statistics?
-The four levels of measurement in statistics are nominal, ordinal, interval, and ratio.
What is the key characteristic of nominal data?
-Nominal data involves naming or labeling variables without any specific order, and it can be either qualitative or quantitative.
How does ordinal data differ from nominal data?
-Ordinal data follows a natural order or ranking, whereas nominal data does not. However, the difference between values in ordinal data is not meaningful.
What is unique about interval data compared to ordinal data?
-Interval data not only has a natural order but also meaningful differences between values. However, it does not have an absolute zero point.
What are some examples of interval data?
-Examples of interval data include temperature measured in Celsius or Fahrenheit and time.
What is the defining feature of ratio data?
-Ratio data has all the properties of interval data, plus a true absolute zero point, allowing for meaningful calculations of differences and ratios.
Can you provide examples of ratio data?
-Examples of ratio data include height, weight, and age.
Why is ratio data considered the most informative level of measurement?
-Ratio data is considered the most informative because it includes an absolute zero point, allowing for full mathematical operations including addition, subtraction, multiplication, and division.
What is a common use of ordinal scales in surveys?
-A common use of ordinal scales in surveys is rating levels of satisfaction, such as 'strongly agree,' 'agree,' 'neutral,' 'disagree,' and 'strongly disagree.'
What does it mean when data is said to be 'mutually exclusive' in the nominal scale?
-Data being 'mutually exclusive' in the nominal scale means that each category is distinct and there is no overlap between them.
What is the main limitation of interval data?
-The main limitation of interval data is that it does not have a true zero point, which can limit the types of statistical analyses that can be performed.
In what context might qualitative data be used?
-Qualitative data might be used in contexts such as describing the characteristics of an object, like the color or type of a hat, or categorizing responses in a survey.
What central tendency measures are used for each level of measurement?
-For nominal data, the mode is used. For ordinal data, both the mode and median are used. For interval data, the mode, median, and arithmetic mean are used. For ratio data, the mode, median, arithmetic mean, and geometric mean are used.
Outlines
📊 Understanding Data and Levels of Measurement
This video introduces the concept of data and different levels of measurement: nominal, ordinal, interval, and ratio. It explains how data can be categorized into quantitative and qualitative types, and describes the sources of data as primary and secondary. Examples include discrete data like the number of students and continuous data like temperature. The video aims to clarify these concepts to help in analyzing and making decisions in business contexts.
🔢 Quantitative vs. Qualitative Data
The video further explains the categorization of data into quantitative (discrete and continuous) and qualitative (categorical). It provides examples like the number of hats and temperature for quantitative data, and color and energy levels for qualitative data. The explanation aims to differentiate between these types and how they are measured.
📐 The Four Levels of Measurement
A detailed explanation of the four levels of measurement—nominal, ordinal, interval, and ratio—is provided. Each level is described with examples: nominal data is named or labeled without order; ordinal data has a specific order but unknown differences; interval data shows order and exact differences but lacks a true zero; ratio data includes order, exact differences, and an absolute zero.
📏 Examples of Measurement Levels
The video offers practical examples of the four measurement levels. Nominal examples include smartphone brands and gender. Ordinal examples involve survey responses like satisfaction levels. Interval examples include temperature and time, with emphasis on the equal spacing between values. Ratio examples cover height, weight, and age, highlighting the inclusion of a true zero.
🔍 Summary and Application of Measurement Levels
The video summarizes the characteristics of each measurement level, including central tendency, difference evaluation, and the ability to perform arithmetic operations. It emphasizes the unique feature of ratio scales having an absolute zero. The video concludes with questions to test understanding, inviting viewers to identify the measurement level for IQ scores, popular video games, and student ages. The video ends with a call to action for viewers to subscribe, like, and comment.
Mindmap
Keywords
💡Data
💡Primary Data
💡Secondary Data
💡Quantitative Data
💡Qualitative Data
💡Discrete Data
💡Continuous Data
💡Nominal Scale
💡Ordinal Scale
💡Interval Scale
💡Ratio Scale
Highlights
Introduction to different levels of measurement: nominal, ordinal, interval, and ratio.
Explanation of data and its importance in analysis and decision-making.
Definition and examples of primary and secondary data sources.
Classification of data into quantitative and qualitative categories.
Examples and explanation of discrete and continuous quantitative data.
Description of qualitative data and its categorization.
Detailed examples differentiating between qualitative and quantitative data using a dog.
Introduction to the four levels of measurement in statistics: nominal, ordinal, interval, and ratio.
Detailed explanation and examples of nominal scale measurement.
Description and examples of ordinal scale measurement.
Explanation of interval scale measurement with relevant examples.
Detailed description and examples of ratio scale measurement.
Summary of the characteristics and differences between the four levels of measurement.
Interactive questions to help understand the concept of levels of measurement.
Encouragement to leave answers and comments to the questions in the comment section.
Call to action to subscribe, like, and share the video.
Transcripts
Browse More Related Video

Nominal, ordinal, interval and ratio data: How to Remember the differences
Classification of Variables and Types of Measurement Scales
Types of Data: Nominal, Ordinal, Interval/Ratio - Statistics Help
Introduction to Levels of Measurement: Nominal, Ordinal, Interval, Ratio

Nominal, Ordinal, Interval & Ratio Data: Simple Explanation With Examples
Scales of Measurement - Nominal, Ordinal, Interval, & Ratio Scale Data
5.0 / 5 (0 votes)
Thanks for rating: