Data Types - Levels of Data Measurements - Nominal Ordinal Interval Ratio | Statistics | Research
TLDRThis script introduces the concept of data measurement levels, distinguishing between nominal, ordinal, interval, and ratio data. Nominal data categorizes without numerical value, while ordinal ranks without equal intervals. Interval data has a meaningful difference between values but no absolute zero, whereas ratio data features an absolute zero and equal intervals, allowing for multiplicative comparisons. The script uses examples like gender, race position, body temperature, and distance to illustrate these levels, emphasizing the importance of understanding data types for accurate analysis.
Takeaways
- 📊 Data can be classified into two main types: qualitative and quantitative, with qualitative data further divided into nominal and ordinal levels, and quantitative data into interval and ratio levels.
- 🏷 Nominal data is used for classification and categorization without any inherent numerical value, such as gender or race, where numbers are used for identification rather than comparison.
- 🔢 Ordinal data indicates rank or order, with numbers representing a sequence or hierarchy, but the differences between the ranks are not necessarily equal, like types of soda based on consumer preference.
- 📊 Interval data shows the order, direction, and exact differences between values, but the zero point is arbitrary and does not represent an absence of the variable, as seen in temperature measurements.
- 📊 Ratio data is the most precise level of measurement, showing order, exact differences, and an absolute zero, which means a true absence of the variable, such as height or weight.
- 🚫 For nominal data, averaging is not meaningful because the numerical assignments are arbitrary and do not reflect magnitude or order.
- 🏁 Ordinal data can show a natural rank order, but the distances between categories are not presumed to be equal, as in the case of socioeconomic status or educational level.
- ❗ Likert scale data is treated as ordinal for individual items due to the potential uneven spacing between responses, but can be considered interval when computed as a composite score from multiple items.
- 🌡 Examples of interval data include temperature, calendar time, and standardized test scores, where the zero point does not signify the absence of the variable.
- 📏 Ratio data examples include height, weight, population, length, area, volume, and monetary variables, where the zero point signifies a complete absence and intervals are comparable.
- 📝 The script emphasizes the importance of understanding the level of data measurement to correctly analyze and interpret data, highlighting the differences in how each type should be treated statistically.
Q & A
What is the definition of data according to the script?
-Data is defined as information that is expressed qualitatively or quantitatively, representing the values of characteristics of a population.
What are the four levels of data measurement mentioned in the script?
-The four levels of data measurement are nominal, ordinal, interval, and ratio.
How are nominal level data different from ordinal level data?
-Nominal level data is used to classify or categorize without any numerical value, while ordinal level data indicates rank or order and the relative magnitude of numbers is meaningful, although the differences are not comparable.
Can you provide an example of nominal level data from the script?
-An example of nominal level data is the variable sex, where numbers zero and one may be assigned to male and female, respectively, for classification purposes only.
Why is averaging nominal data not meaningful?
-Averaging nominal data is not meaningful because the number assignments are arbitrary and do not represent any numerical value, thus the average would have no informational content.
What is the significance of ordinal level data in ranking?
-Ordinal level data is significant in ranking as it incorporates an ordered position or ranking of elements, showing the relative positions such as first, second, or third.
How does interval level data differ from ordinal level data?
-Interval level data shows order, direction, and exact differences in value, but the zero point is arbitrary and not absolute, unlike ordinal data which does not have equal intervals between categories.
What is an example of interval level data mentioned in the script?
-Examples of interval level data include temperature measured in degrees Celsius, calendar time, and standardized test scores.
How is ratio level data different from interval level data?
-Ratio level data, like interval data, shows order, direction, and exact differences in value, but it also has an absolute zero point, meaning a zero value indicates the total absence of the variable being measured.
Can you provide an example of ratio level data from the script?
-Examples of ratio level data include height, weight, population, length, area, volume, monetary variables like sales, price, revenues, expenses, and temperature in Kelvin.
Why is the zero point in ratio level data considered absolute?
-The zero point in ratio level data is absolute because it indicates a total absence of the variable being measured, unlike interval data where zero is arbitrary.
How are Likert scale responses treated in terms of data measurement levels?
-Individual Likert scale responses are treated as ordinal level data, but when computed as a composite score from multiple questions, they can be treated as interval level data.
Outlines
📊 Understanding Data Measurement Levels
This paragraph introduces the concept of data measurement levels, distinguishing between nominal, ordinal, interval, and ratio data. Nominal and ordinal data are qualitative, used for classification and ranking without implying any magnitude or order of difference. Interval and ratio data are quantitative, with interval data having a fixed unit size but arbitrary zero point, and ratio data having a true zero point, allowing for meaningful comparisons of ratios. Examples provided include gender, race position, body temperature, and distance traveled to illustrate each level.
🔢 Exploring Ordinal and Interval Data
The second paragraph delves deeper into ordinal and interval data, explaining that ordinal data indicates rank or order but does not allow for comparison of the differences between ranks. Interval data, however, shows the exact difference in value and has an arbitrary zero point. Examples such as socioeconomic status, educational level, temperature, calendar time, and standardized test scores are given to clarify these concepts. The paragraph also discusses Likert scale data, which can be treated as interval data when aggregated.
📐 Ratio Data and Data Measurement Summary
The final paragraph focuses on ratio data, which has all the properties of interval data but with an absolute zero point, allowing for true zero absence of the variable being measured. It contrasts this with nominal and ordinal data, which do not allow for such comparisons. The paragraph summarizes the key points by reiterating the characteristics of each data measurement level, emphasizing the importance of understanding these levels for accurate data analysis and interpretation.
Mindmap
Keywords
💡Data Measurement
💡Qualitative Data
💡Quantitative Data
💡Nominal Data
💡Ordinal Data
💡Interval Data
💡Ratio Data
💡Variables
💡Sample Values
💡Likert Scale
💡Statistical Analysis
Highlights
Data can be defined as information that is expressed qualitatively or quantitatively, representing the values of characteristics of a population.
Four levels of data measurement are nominal, ordinal, interval, and ratio, with the first two being qualitative and the last two being quantitative.
Nominal level data uses numbers to classify or categorize qualitative data without any numerical value or magnitude.
Examples of nominal data include sex or gender, employment classification, and eye color characteristics.
Averaging nominal data is meaningless as the number assignments are arbitrary and do not convey information.
Ordinal level data indicates rank or order, with the relative magnitude of numbers being meaningful but not comparable.
Examples of ordinal data include types of soda based on consumer preference, positions within an organization, and race finish order.
Likert scale responses are treated as ordinal data, with categories having a natural rank order but uneven distances between them.
Interval level data shows order, direction, and exact differences in value, with an arbitrary or non-absolute zero.
Examples of interval data include temperature, calendar time, and standardized test scores, which lack an absolute zero.
Likert scale data can be treated as interval level when computed from a scale, allowing for mean, standard deviation, and confidence interval calculations.
Ratio level data shows order, exact differences in value, and has an absolute zero, indicating a total absence of the variable being measured.
Examples of ratio data include height, weight, population, length, area, volume, sales, price, revenues, expenses, and temperature in Kelvin.
Ratio data allows for meaningful interpretation of ratios between measurements, such as a person being twice as tall as another.
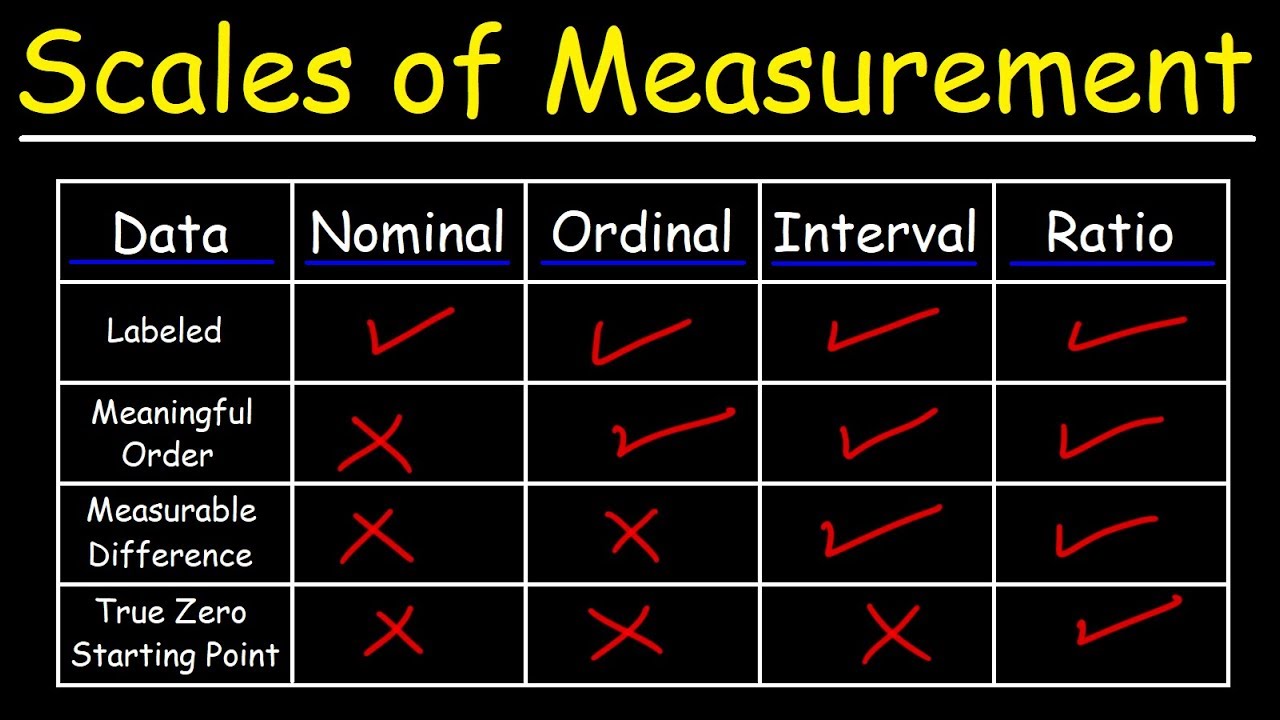
To summarize, nominal data classifies, ordinal data indicates rank, interval data shows exact differences with arbitrary zero, and ratio data shows exact differences with an absolute zero.
Transcripts
Browse More Related Video

Nominal, Ordinal, Interval & Ratio Data: Simple Explanation With Examples
Introduction to Levels of Measurement: Nominal, Ordinal, Interval, Ratio
Scales of Measurement - Nominal, Ordinal, Interval, Ratio (Part 2) - Introductory Statistics
Types of Data: Nominal, Ordinal, Interval/Ratio - Statistics Help
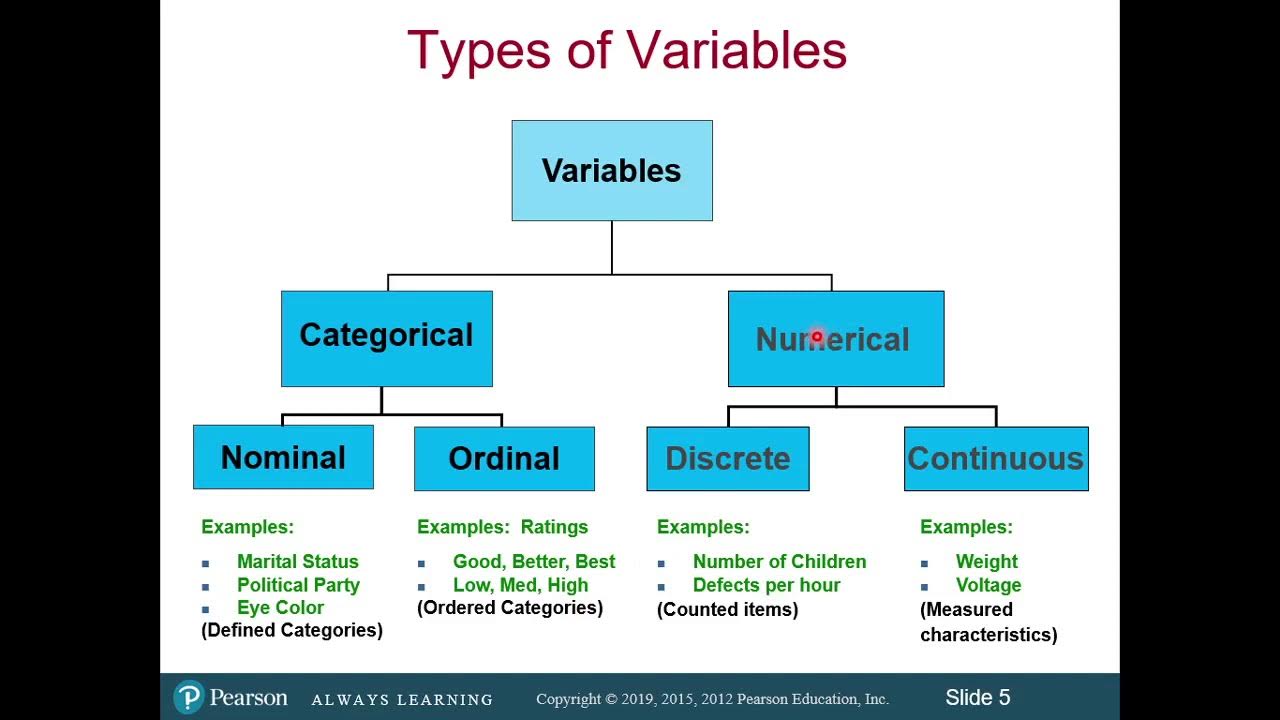
Classification of Variables and Types of Measurement Scales
Scales of Measurement - Nominal, Ordinal, Interval, & Ratio Scale Data
5.0 / 5 (0 votes)
Thanks for rating: