Sampling distribution example problem | Probability and Statistics | Khan Academy
TLDRThe script explores the probability of running out of water during a nature trip with 50 men, given an average water consumption of 2 liters per person with a standard deviation of 0.7 liters. It explains the concept of the sampling distribution of the sample mean and how it relates to the normal distribution. The presenter calculates the standard deviation of the sample mean and uses a Z-table to find the probability of the sample mean exceeding 2.2 liters, concluding with a 2.17% chance of water shortage.
Takeaways
- 💧 The average male consumes 2 liters of water when active outdoors with a standard deviation of 0.7 liters.
- 📈 A normal distribution is assumed for the water consumption of the average man, even though the actual distribution is not confirmed.
- 🧭 Planning involves a full-day nature trip for 50 men with 110 liters of water, aiming to estimate the probability of running out.
- 📦 The critical threshold for water shortage is set at an average consumption of 2.2 liters per man for the group.
- 🔢 The mean water consumption per man is calculated by dividing the total amount of water (110 liters) by the number of men (50).
- 📊 The sampling distribution of the sample mean is considered to be normally distributed due to the Central Limit Theorem.
- 📉 The standard deviation of the sampling distribution is calculated as the population standard deviation (0.7 liters) divided by the square root of the sample size (50), resulting in 0.099 liters.
- 🌐 The probability of running out of water is equivalent to the probability that the sample mean exceeds 2.2 liters per man.
- 📝 To find this probability, calculate the Z-score, which is the difference between the critical value (2.2 liters) and the mean (2 liters) divided by the standard deviation of the sampling distribution (0.099 liters).
- 🔑 Using a Z-table, the probability of the sample mean being more than 2.02 standard deviations above the mean is found to be 0.9783.
- 🎯 The final step is to subtract this probability from 1 to find the chance of running out of water, which is approximately 2.17%.
Q & A
What is the average amount of water a male drinks when active outdoors according to the script?
-The average male drinks 2 liters of water when active outdoors.
What is the standard deviation of the water consumption in this scenario?
-The standard deviation of the water consumption is 0.7 liters.
How many liters of water are being planned to be brought for a nature trip for 50 men?
-110 liters of water are planned to be brought for the nature trip for 50 men.
What is the probability calculation about in the context of the script?
-The probability calculation is about the chance of running out of water during the nature trip.
What is the average water consumption per man if there are 110 liters for 50 men?
-If there are 110 liters for 50 men, the average water consumption per man would be 2.2 liters.
Why is the sampling distribution of the sample mean considered to be a normal distribution?
-The sampling distribution of the sample mean is considered to be a normal distribution due to the Central Limit Theorem, which states that the distribution of sample means will approach a normal distribution as the sample size increases, regardless of the shape of the population distribution.
How is the standard deviation of the sampling distribution of the sample mean calculated?
-The standard deviation of the sampling distribution of the sample mean is calculated by dividing the population standard deviation by the square root of the sample size (n).
What is the Z-score and why is it important in this context?
-The Z-score is a measure of how many standard deviations an element is from the mean. It is important in this context because it helps determine the probability of the sample mean being more than 2.2 liters per man, which would indicate running out of water.
What does the Z-table represent and how is it used in this scenario?
-The Z-table represents the cumulative probability of a standard normal distribution. It is used in this scenario to find the probability of the sample mean being more than 2.02 standard deviations above the mean, which corresponds to a Z-score of 2.02.
What is the final probability calculated for running out of water during the nature trip?
-The final probability calculated for running out of water during the nature trip is 2.17%.
How does the script suggest that the distribution of water consumption might look like for the average man?
-The script suggests that the distribution might be skewed, with most men needing around the average of 2 liters, some needing less, and others needing more, but no one needing more than about 4 liters.
Outlines
💧 Calculating Water Needs for a Nature Trip
This paragraph discusses the statistical approach to determining the probability of running out of water during a nature trip with 50 men. The average water consumption is given as 2 liters with a standard deviation of 0.7 liters. The trip organizer plans to bring 110 liters of water and seeks to understand the likelihood of this amount being insufficient. The explanation involves understanding the distribution of water needs, calculating the sample mean, and determining the probability that the average consumption per man will exceed 2.2 liters, which would deplete the water supply.
📊 Understanding the Sampling Distribution of the Sample Mean
The second paragraph delves into the concept of the sampling distribution of the sample mean, explaining how it applies to the water consumption scenario. It clarifies that even if the original distribution of water needs is not normal, the sampling distribution of the sample mean will be normal due to the Central Limit Theorem. The mean of this distribution is the same as the population mean, 2 liters, but the standard deviation is reduced by a factor of the square root of the sample size, resulting in a standard deviation of 0.099 liters for the sample mean. The goal is to find the probability that the sample mean exceeds 2.2 liters, which would indicate a water shortage.
📉 Using the Z-Score to Determine Water Shortage Probability
The final paragraph concludes the analysis by calculating the Z-score to find the probability of the sample mean exceeding 2.2 liters. The Z-score is calculated as the difference between the critical value (2.2 liters) and the mean (2 liters), divided by the standard deviation of the sampling distribution (0.099 liters), resulting in a Z-score of 2.02. By consulting a Z-table, the probability of being more than 2.02 standard deviations above the mean is found to be 0.9783. Subtracting this from 1 gives the probability of running out of water, which is 0.0217, or 2.17%. This step-by-step process provides a clear statistical method to assess the risk of water shortage for the planned trip.
Mindmap
Keywords
💡Average
💡Standard Deviation
💡Probability
💡Liters
💡Nature Trip
💡Sample Mean
💡Sampling Distribution
💡Normal Distribution
💡Z-Score
💡Z-Table
Highlights
The average male requires 2 liters of water when active outdoors, with a standard deviation of 0.7 liters.
Planning a nature trip for 50 men with 110 liters of water brings up the question of water sufficiency.
The probability of running out of water is equated to the likelihood of average water consumption exceeding 2.2 liters per man.
A sampling distribution of the sample mean is introduced to determine the likelihood of water shortage.
The mean of the sampling distribution of the sample mean equals the population mean, which is 2 liters.
The standard deviation of the sampling distribution of the sample mean is calculated as the population standard deviation divided by the square root of the sample size.
For a sample size of 50, the standard deviation of the sample mean is approximately 0.099 liters.
The problem is reframed as finding the probability that the sample mean water consumption is greater than 2.2 liters.
A Z-score is calculated to determine how many standard deviations above the mean the critical value of 2.2 liters lies.
The Z-score calculation involves dividing the difference between the critical value and the mean by the standard deviation of the sampling distribution.
The Z-score for the critical value of 2.2 liters is approximately 2.02 standard deviations above the mean.
A Z-table is used to find the probability that the sample mean exceeds the critical value.
The probability of the sample mean being more than 2.02 standard deviations above the mean is found to be 0.9783 from the Z-table.
The final probability of running out of water is calculated by subtracting the Z-table probability from 1, resulting in 0.0217 or 2.17%.
The conclusion is that there is a 2.17% chance of running out of water during the planned nature trip.
Transcripts
Browse More Related Video
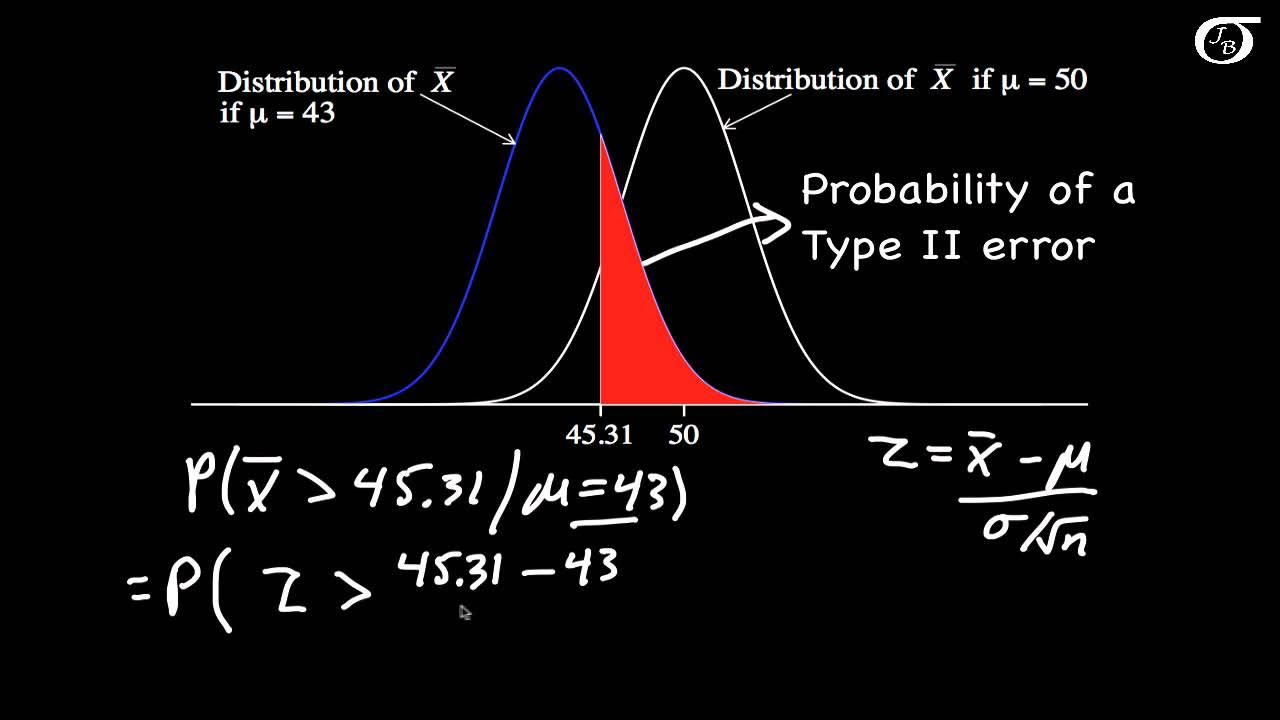
Calculating Power and the Probability of a Type II Error (A One-Tailed Example)
Math 14 HW 6.4.6-T Using the Central Limit Theorem

The Probability an Elevator is Overloaded Central Limit Theorem with StatCrunch
Standard error of the mean | Inferential statistics | Probability and Statistics | Khan Academy
SAMPLING DISTRIBUTION OF SAMPLE MEANS - WITH AND WITHOUT REPLACEMENT

Math 14 HW 6.4.15-T Using the Central Limit Theorem
5.0 / 5 (0 votes)
Thanks for rating: