SAMPLING DISTRIBUTION OF SAMPLE MEANS - WITH AND WITHOUT REPLACEMENT
TLDRThe video script discusses the concept of sampling distribution of sample means, emphasizing its significance in statistical inference. It illustrates the process of calculating the mean and standard deviation of a population and contrasts sampling with and without replacement. The example uses a population of four numbers and calculates the mean and standard deviation for samples of size 2, highlighting the theoretical distribution of sample means.
Takeaways
- 📊 Understanding the sampling distribution of sample means is crucial in statistics as it simplifies the foundation of statistical inference.
- 🔢 The population mean is calculated by summing all population elements and dividing by the number of elements (2 + 5 + 6 + 10) / 4 = 5.75.
- 📈 The population standard deviation is found using a formula involving the square root of the sum of (x - population mean)^2 over the population size, resulting in a value of 2.8609.
- 🔄 With replacement sampling lists all possible combinations of two numbers from the population, such as (2,2), (2,5), (2,6), (2,10), and so on.
- 🏆 The mean of the sampling distribution with replacement is the same as the population mean, which is 5.75.
- 📉 The standard deviation of the sampling distribution with replacement is calculated by summing the squared differences from the population mean and dividing by the number of samples, resulting in a value of approximately 2.0.
- 🔄 Without replacement sampling considers the order of selection and does not allow repeated elements, leading to a reduced number of possible samples.
- 🏅 The mean of the sampling distribution without replacement is also the same as the population mean, which is 5.75.
- 📊 The standard deviation of the sampling distribution without replacement is higher than with replacement due to the reduced number of samples and the consideration of order, with a value of approximately 2.73.
- 🔢 The process of calculating the mean and standard deviation for both with and without replacement sampling involves a systematic approach to summing and squaring differences from the population mean.
- 📝 The script provides a detailed example of how to work through the calculations step by step, emphasizing the importance of understanding the underlying statistical principles.
Q & A
What is the sampling distribution of sample means?
-The sampling distribution of sample means is a theoretical distribution that describes the distribution of an infinite number of sample means, all of the same size, taken from a population.
Why is the sampling distribution important in statistics?
-The sampling distribution is important in statistics because it provides a major simplification at the root of statistical inference, allowing us to make inferences about population parameters based on sample statistics.
How is the population mean calculated?
-The population mean is calculated by adding all the numbers in the population and then dividing by the population size. In the given example, the population mean is (2 + 5 + 6 + 10) / 4 = 5.75.
What is the formula for calculating the population standard deviation?
-The formula for the population standard deviation is the square root of the summation of (x - population mean)^2 over n, where x represents the numbers in the population and n is the population size.
What are the steps to calculate the standard deviation for the population in the given example?
-First, calculate the differences between each number (x) and the population mean. Then, square these differences. Sum up all the squared differences and divide by the population size (n). Finally, take the square root of the result to get the standard deviation, which for the given example is approximately 2.8609.
How does the process of calculating the mean of the sampling distribution with replacement differ from without replacement?
-With replacement, all possible samples of size 2 can be drawn from the population, leading to more combinations. Without replacement, once a number is drawn, it cannot be drawn again for that specific sample, resulting in fewer combinations. The mean is calculated by summing the sample means and dividing by the number of samples.
What is the mean of the sampling distribution with replacement?
-The mean of the sampling distribution with replacement is the same as the population mean, which is 5.75, as calculated by summing all sample means (92) and dividing by the number of samples (16).
What is the standard deviation of the sampling distribution with replacement?
-The standard deviation of the sampling distribution with replacement is approximately 2.027, calculated by summing the squared differences between each sample mean and the population mean, dividing by the number of samples, and then taking the square root.
How many samples of size 2 can be drawn without replacement from the given population?
-There are six possible samples of size 2 that can be drawn without replacement from the given population: (2, 5), (2, 6), (2, 10), (5, 6), (5, 10), and (6, 10).
What is the mean of the sampling distribution without replacement?
-The mean of the sampling distribution without replacement is also 5.75, calculated by summing the sample means (34.5) and dividing by the number of samples (6).
What is the standard deviation of the sampling distribution without replacement?
-The standard deviation of the sampling distribution without replacement is approximately 1.6513, calculated by summing the squared differences between each sample mean and the population mean, dividing by the number of samples, and then taking the square root.
How does the number of possible samples affect the mean and standard deviation of the sampling distribution?
-The number of possible samples affects the mean and standard deviation by influencing the variability of the sample means. More samples generally lead to a more accurate representation of the population parameters, potentially reducing the standard deviation of the sampling distribution. The mean, however, should remain consistent with the population mean, assuming an unbiased sampling process.
Outlines
📊 Introduction to Sampling Distribution of Sample Means
This paragraph introduces the concept of the sampling distribution of sample means, emphasizing its significance in statistics as a foundation for statistical inference. It explains that the sampling distribution represents the theoretical distribution of an infinite number of sample means from equal-sized samples drawn from a population. A practical problem is presented to illustrate the concept, where a population consisting of four numbers (2, 5, 6, and 10) is used to calculate the population mean and standard deviation. The population mean is found to be 5.75, and the process for calculating the population standard deviation is outlined, involving the use of a table to organize the calculations.
🧮 Calculation with Replacement in Sampling Distribution
The second paragraph delves into the specifics of calculating the mean and standard deviation of the sampling distribution when samples are drawn with replacement. It lists all possible samples of size 2 from the given population and demonstrates how to calculate the sample mean for each combination. The process involves summing the sample numbers and dividing by the sample size (in this case, 2). The paragraph then explains how to find the difference between each sample mean and the population mean, square these differences, and use them to calculate the standard deviation of the sampling distribution with replacement.
📈 Mean and Standard Deviation with and without Replacement
This paragraph compares the calculation of the mean and standard deviation of the sampling distribution with and without replacement. It begins by detailing the process for samples drawn with replacement, showing the calculation of the mean and standard deviation using a series of summations and divisions. The paragraph then transitions to samples drawn without replacement, listing the possible combinations and calculating their means. The differences between the sample means and the population mean are calculated, squared, and used to determine the standard deviation for the sampling distribution without replacement. The results are compared to the calculations with replacement, highlighting the differences in the two scenarios.
🔢 Final Calculations for Sampling Distribution without Replacement
The final paragraph focuses exclusively on the calculations for the sampling distribution without replacement. It presents the process of finding the mean of the sampling distribution by summing the sample means and dividing by the number of samples. The paragraph then explains the calculation of the standard deviation for the sampling distribution without replacement, which involves summing the squared differences between each sample mean and the population mean, dividing by the sample size, and taking the square root of the result. The paragraph concludes with the final values for the mean and standard deviation of the sampling distribution when samples are drawn without replacement.
Mindmap
Keywords
💡Sampling Distribution
💡Population Mean
💡Population Standard Deviation
💡Sample Mean
💡Standard Deviation
💡With Replacement
💡Without Replacement
💡Statistical Inference
💡Sample Size
💡Summation
💡Squared Differences
Highlights
The concept of sampling distribution is introduced, which characterizes the distribution of sample means drawn from a population.
Sampling distribution is essential in statistics as it simplifies the foundation of statistical inference.
The population mean is calculated by adding all population elements and dividing by the population size, resulting in a mean of 5.75 for the given population.
The population standard deviation is calculated using a formula involving the square root of the summation of (x - population mean)^2 over the population size, resulting in a standard deviation of 2.8609.
The process of calculating the mean and standard deviation of the sampling distribution with replacement is detailed, listing all possible samples of size 2.
The mean of the sampling distribution with replacement is found to be 5.75, which is the same as the population mean.
The standard deviation of the sampling distribution with replacement is calculated to be approximately 2.0.
The process for calculating the mean and standard deviation of the sampling distribution without replacement is also described, with a different set of possible samples.
The mean of the sampling distribution without replacement is also found to be 5.75, consistent with the population mean.
The standard deviation of the sampling distribution without replacement is calculated to be approximately 1.6513.
The transcript provides a comprehensive step-by-step guide to understanding and calculating sampling distributions, which is beneficial for statistical analysis.
The use of tables in the transcript aids in visualizing the calculations and differences between with and without replacement sampling distributions.
The transcript demonstrates the mathematical principles behind sampling distributions, reinforcing the theoretical underpinnings of statistical inference.
The practical application of these calculations can be used to make inferences about population parameters based on sample data.
The transcript's detailed explanation of sampling distributions can help students and researchers better grasp the fundamentals of statistics.
The distinction between sampling with and without replacement is clearly explained, highlighting the different implications for the sampling distribution.
The transcript's methodical approach to solving statistical problems serves as an effective educational tool for those learning about sampling distributions.
Transcripts
Browse More Related Video
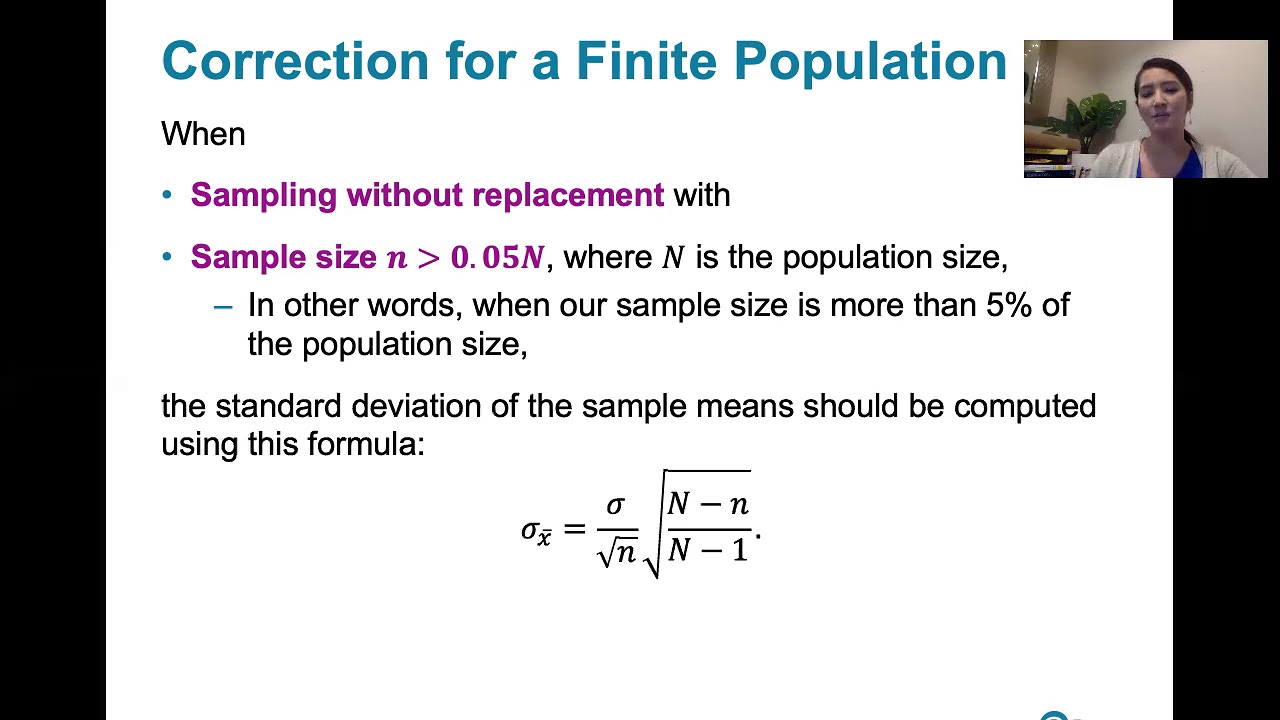
6.4.4 The Central Limit Theorem - Finite Population Correction Factor
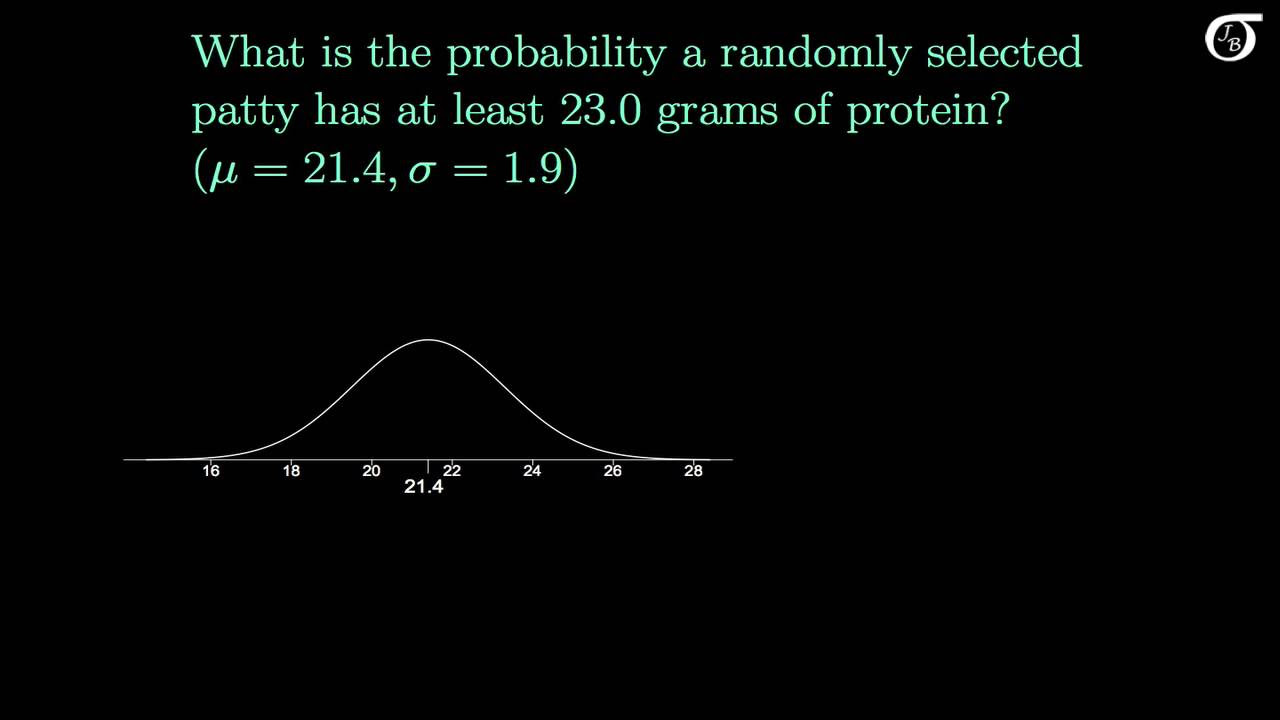
The Sampling Distribution of the Sample Mean
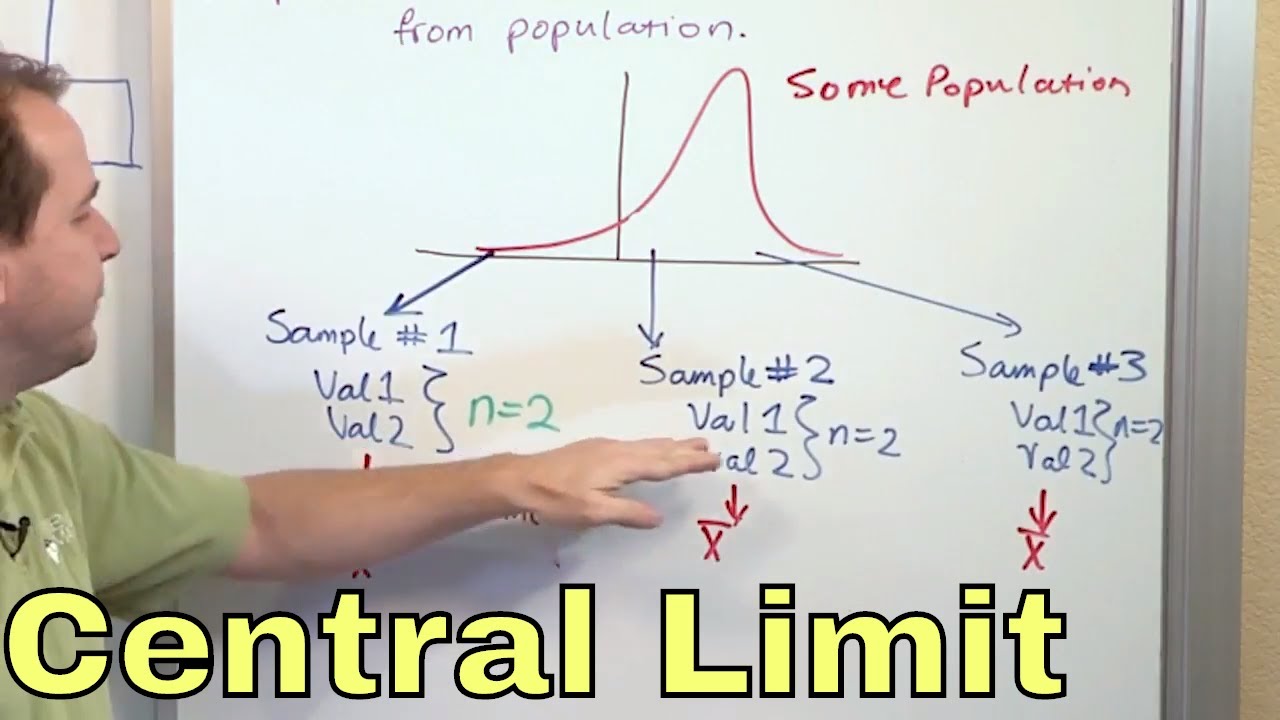
02 - What is the Central Limit Theorem in Statistics? - Part 1
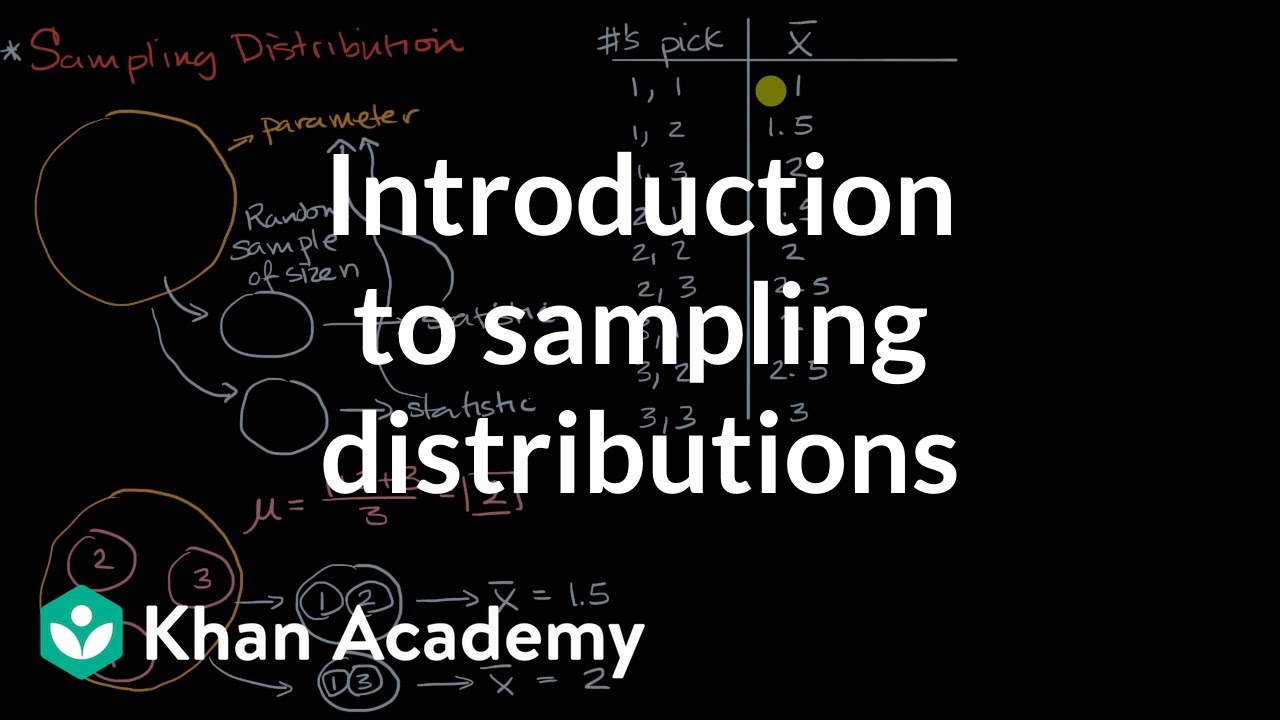
Introduction to sampling distributions | Sampling distributions | AP Statistics | Khan Academy
Central Limit Theorem & Sampling Distribution Concepts | Statistics Tutorial | MarinStatsLectures
Math 14 HW 6.3.11 Is a sample mean an unbiased estimator of the population mean?
5.0 / 5 (0 votes)
Thanks for rating: