The Maths Prof: Frequency Tables (Mean, Median, Mode & Range)
TLDRIn this educational video, the maass Prof teaches viewers how to calculate mean, median, mode, and range using a frequency table. The video provides a step-by-step guide, starting with the mean calculation by multiplying each score by its frequency and dividing by the total number of occurrences. It then explains how to find the median by identifying the middle value(s) in an ordered list. The mode, the most frequent score, is easily identified from the frequency column. Lastly, the range is calculated by subtracting the smallest score from the highest. The video uses two examples, rolling a dice and student test scores, to demonstrate these calculations, emphasizing the importance of checking for sensible answers within the possible range of values.
Takeaways
- 📊 Frequency tables are used to simplify calculations when dealing with large datasets, like rolling a dice 50 times.
- 🧮 To calculate the mean, multiply each score by its frequency and sum these products, then divide by the total number of occurrences.
- 🎯 The median is the middle value in a dataset. For an even number of scores, it's the average of the two middle numbers.
- 📈 The mode is the score that appears most frequently in the dataset.
- 🔢 The range of a dataset is calculated by subtracting the smallest score from the highest score.
- 🤔 When calculating averages, it's important to ensure that the results are sensible and fall within the possible range of scores.
- 📝 For the mean, remember to use brackets in your calculator to ensure the entire sum is divided by the total number of scores.
- 📉 To find the median in an odd-numbered dataset, add one to the total number of scores, then divide by two to find the middle position.
- 📋 When working with frequency tables, it's beneficial to write down each step to avoid mistakes and ensure accuracy.
- 🔑 The script provides a step-by-step guide for calculating mean, median, mode, and range using a frequency table.
- 👩🏫 The video also covers a second example with test scores, demonstrating the process with a different dataset.
Q & A
What is the purpose of using a frequency table when dealing with large sets of data?
-A frequency table is used to simplify calculations and reduce the likelihood of errors when working with large sets of data. It allows us to represent the occurrence of each unique value without having to list all the individual instances.
How do you calculate the mean from a frequency table?
-To calculate the mean from a frequency table, you multiply each unique value by its frequency, sum all these products, and then divide the total by the sum of the frequencies, which represents the total number of data points.
What is the mean score for rolling a dice 50 times according to the video?
-The mean score for rolling a dice 50 times, as calculated in the video, is 3.52.
How is the median different from the mean, and how do you find it in a frequency table?
-The median is the middle value in a data set when it is ordered from smallest to largest, whereas the mean is the average of all values. In a frequency table, you determine the median by finding the middle position(s) based on the total number of data points. If the total is even, the median is the average of the two middle numbers.
What is the median score of the dice rolls in the video example?
-The median score of the dice rolls in the video example is four, as both the 25th and 26th scores fall into the frequency of the number four.
What is the mode in a frequency table, and how do you determine it?
-The mode is the value that appears most frequently in a data set. In a frequency table, you determine the mode by identifying the highest frequency value.
What is the mode score for the dice rolls in the video example?
-The mode score for the dice rolls in the video example is two, as it has the highest frequency of 11.
How do you calculate the range of a data set from a frequency table?
-The range of a data set is calculated by subtracting the smallest value from the largest value in the set. In a frequency table, you simply identify the highest and lowest values and perform this subtraction.
What is the range of scores for the dice rolls in the video example?
-The range of scores for the dice rolls in the video example is five, as the highest score is six and the lowest is one.
How do you ensure your calculated averages are sensible in the context of the data set?
-To ensure calculated averages are sensible, you should check that they fall within the range of possible values for the data set. For example, if the data set consists of dice rolls, the mean, median, and mode should all fall between one and six.
What is the mean score of the students' test results in the second example provided in the video?
-The mean score of the students' test results in the second example is approximately 3.003, when rounded to three significant figures.
How do you find the median student score in the second example with an odd number of students?
-For an odd number of students, you find the median by adding one to the total number of students, dividing by two, and then locating the corresponding student score in the frequency table. In the second example, the median is the score of the 18th student, which is three.
What is the mode of the students' test results in the second example?
-The mode of the students' test results in the second example is four, as it has the highest frequency according to the frequency table.
What is the range of the students' test results in the second example?
-The range of the students' test results in the second example is five, as the highest score is five and the lowest is zero.
Outlines
🎲 Calculating Mean, Median, Mode, and Range with a Frequency Table
The video script begins with an introduction to the concept of using frequency tables to calculate statistical measures like mean, median, mode, and range, especially when dealing with large datasets. The example given involves rolling a dice 50 times and recording the results in a frequency table. The mean is calculated by multiplying each score by its frequency and summing these products, then dividing by the total number of rolls (50). The result is a mean of 3.52, which is a sensible average given the possible dice scores. The median is determined by finding the middle values in the ordered list of scores, which are the 25th and 26th scores, both being the number four, hence the median is four. The mode, the most frequent score, is identified as two, with the highest frequency of 11. Lastly, the range is calculated by subtracting the smallest score (one) from the largest score (six), resulting in a range of five. The video emphasizes the importance of ensuring that the calculated averages fall within a logical range.
📊 Applying Statistical Calculations to Test Results with a Frequency Table
The second paragraph of the script discusses another example involving 35 students and their test results, which are presented in a frequency table. The mean is calculated in a similar manner to the dice example, by multiplying the frequency by the score and summing these products, then dividing by the total number of students (35). The calculated mean is approximately 3.003, rounded to three significant figures. To find the median, the script explains that since there is an odd number of students, the middle one is the 18th student, which corresponds to a score of three. The mode is determined by identifying the score with the highest frequency, which is four in this case. The range is calculated by subtracting the lowest score (zero) from the highest score (five), resulting in a range of five. The video script concludes by reminding viewers to check the sensibility of their calculated averages, ensuring they fall within the expected range of possible scores.
📚 Summary of Calculating Averages with Frequency Tables
The final paragraph of the script wraps up the lesson by summarizing the process of calculating averages from a frequency table. It reiterates the importance of ensuring that the calculated mean, median, mode, and range are sensible and fall within the expected range of values. The script also hints at a future video that will cover calculations when given a frequency diagram, suggesting a continuation of the topic. The video ends with a sign-off and background music, indicating the conclusion of the tutorial.
Mindmap
Keywords
💡Mean
💡Median
💡Mode
💡Range
💡Frequency Table
💡Dice Rolls
💡Scores
💡Significant Figures
💡Calculation
💡Contextualization
Highlights
Introduction to calculating mean, median, mode, and range using a frequency table.
Explanation of frequency tables as a practical tool for handling large datasets.
Demonstration of calculating the mean by summing the products of values and their frequencies, then dividing by the total number of observations.
Clarification on multiplying each value by its frequency to avoid lengthy addition.
Example calculation of the mean for rolling a dice 50 times, resulting in a mean score of 3.52.
Meaningful interpretation of the mean score falling between the minimum and maximum dice scores.
Method for finding the median in a dataset with an even number of observations, focusing on the two middle values.
Identification of the median as a score of four, based on the frequency distribution of dice rolls.
Definition and calculation of the mode as the value with the highest frequency, which in this case is two.
Explanation of the range as the difference between the highest and lowest scores, resulting in a range of five for the dice example.
Emphasis on verifying the sensibility of calculated averages to ensure they fall within the expected range.
Second example involving calculating averages from students' test results.
Process of calculating the mean for test results by multiplying frequencies with scores and dividing by the total number of students.
Presentation of the mean test result as 3.003, rounded to three significant figures.
Determination of the median in a dataset with an odd number of observations, pinpointing the exact middle value.
Identification of the median test score as three, based on the ordered frequency distribution.
Mode identified as the score with the highest frequency, which is four in the students' test results example.
Calculation of the range of test scores, highlighting the difference between the highest and lowest scores.
Advice on ensuring calculations are correct by checking times, plus symbols, and using brackets appropriately.
Conclusion and sign-off, with a teaser for another video on frequency diagrams.
Transcripts
Browse More Related Video
Mean, Median and Mode - Measures of Central Tendency
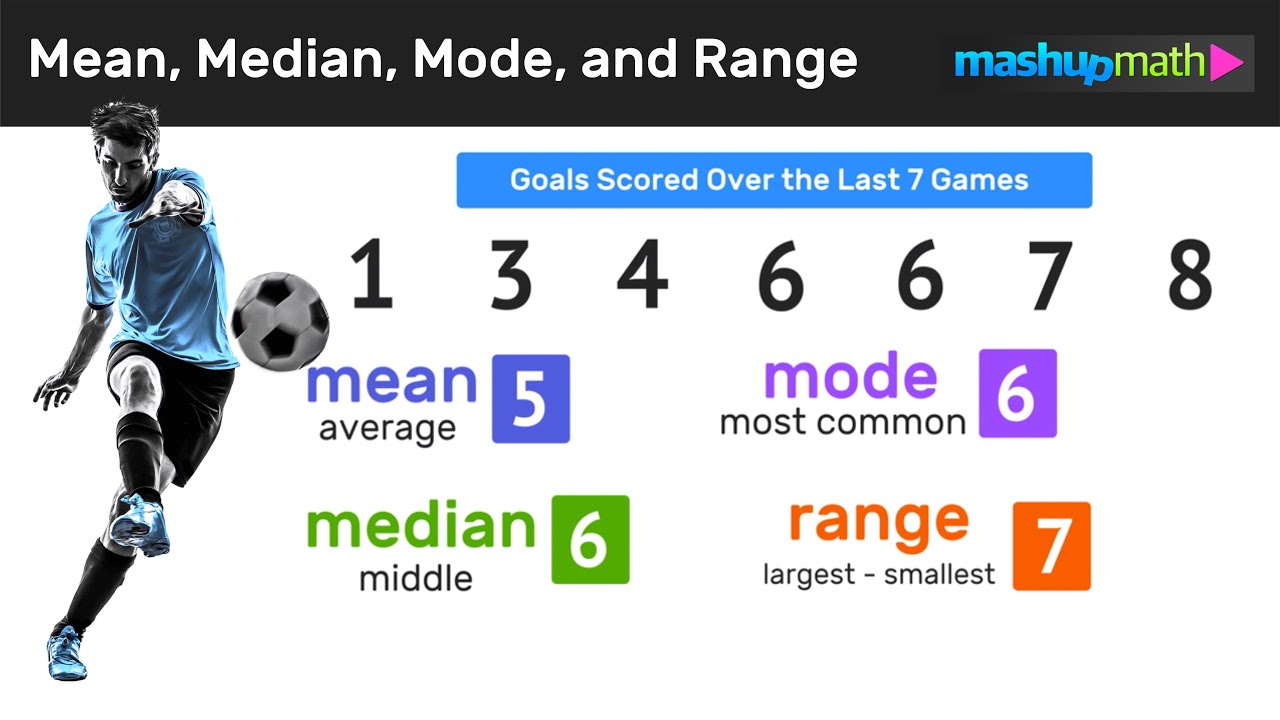
How to Find the Mean, Median, Mode, and Range
Mean, Median, Mode, and Range | Math with Mr. J

Mean, Median, Mode, and Range using Legos
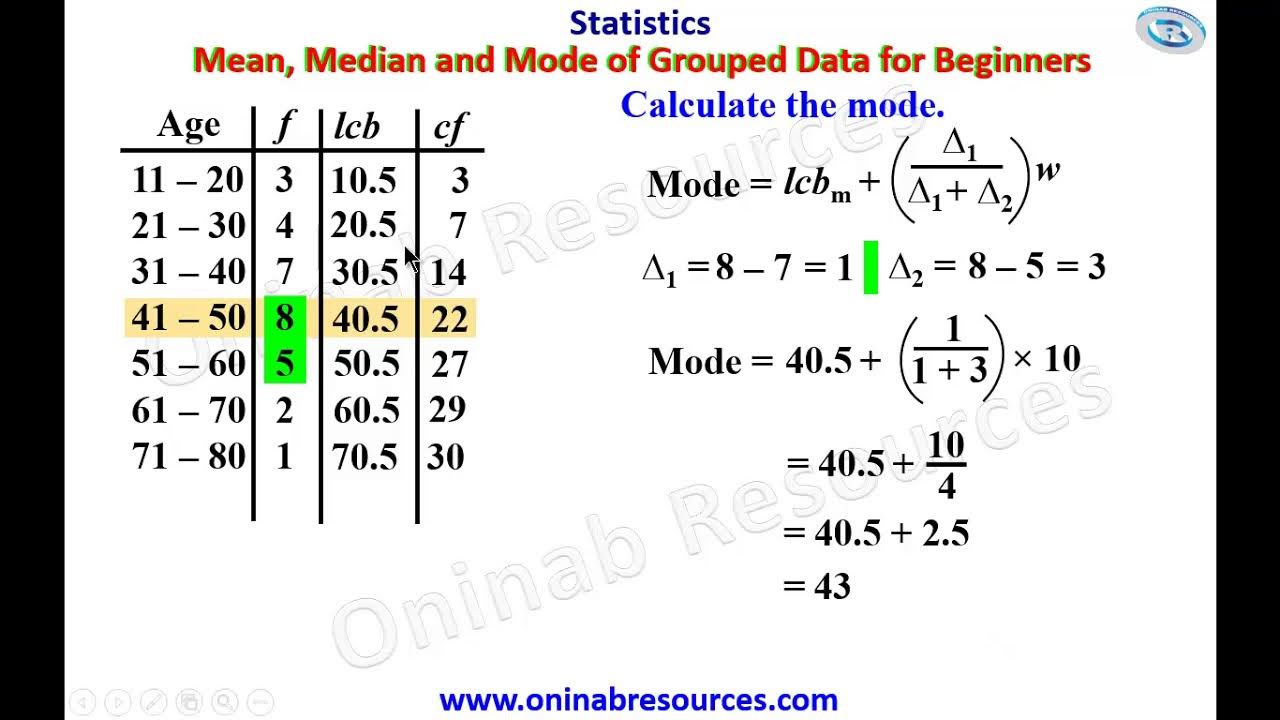
Measure of Central Tendency of Grouped Data for beginners

Mean, Median, and Mode of Grouped Data & Frequency Distribution Tables Statistics
5.0 / 5 (0 votes)
Thanks for rating: