Mean, Median and Mode - Measures of Central Tendency
TLDRThis video script delves into measures of central tendency, such as mean, median, and mode, explaining their calculation and significance in data analysis. The mean is calculated by dividing the sum of observations by their count, exemplified by a mean test score of 86.6 from scores 85, 90, 78, 92, and 88. The median is the middle value in an ordered set, unaffected by outliers, unlike the mean. The mode is the most frequent value in a data set, with sets being classified as unimodal, bimodal, multimodal, or having no mode. The script also contrasts these with measures of dispersion, like standard deviation and range, which describe data spread around the central point. The video aims to clarify the role of central tendency measures in identifying a central value around which data points cluster.
Takeaways
- 📊 Measures of central tendency include the mean, median, and mode, which are used to find a central value in a dataset.
- 🧮 The arithmetic mean is calculated by summing all observations and dividing by the number of observations.
- 📚 An example given was calculating the mean test score of five students, which was found to be 86.6.
- 🔢 The median is the middle value in a dataset when arranged in ascending order, and is resistant to outliers.
- 👥 With an odd number of data points, the median is the single middle value, and with an even number, it's the average of the two middle values.
- 📏 The median is not affected by extreme values, unlike the mean, which can be skewed by outliers.
- 🔠 The mode is the value that appears most frequently in a dataset and can be used to identify common occurrences.
- 🎲 A dataset can be unimodal (one mode), bimodal (two modes), multimodal (more than two modes), or have no mode at all.
- 🌐 Measures of dispersion, such as standard deviation, range, and interquartile range, describe the spread of data points around the central value.
- 🔄 Measures of central tendency help identify a central value, while measures of dispersion indicate how spread out the data is.
- 📈 Both central tendency and dispersion measures are important for understanding the characteristics of a dataset.
Q & A
What are measures of central tendency?
-Measures of central tendency are statistical measures that identify the central position within a data set. They include mean, median, and mode.
What is the arithmetic mean and how is it calculated?
-The arithmetic mean is the average of a set of numerical values. It is calculated by summing all the observations and then dividing by the number of observations.
Can you provide an example of calculating the mean score from the transcript?
-Sure. If we have test scores of 85, 90, 78, 92, and 88, the mean score is calculated as (85 + 90 + 78 + 92 + 88) / 5, which equals 86.6.
How is the median defined and how do you find it in a data set?
-The median is the middle value in a data set when the numbers are arranged in ascending order. If there is an odd number of data points, the median is the middle one. If there is an even number, it's the average of the two middle values.
Why is the median considered resistant to extreme values or outliers?
-The median is resistant to outliers because it represents the middle value of a data set, unaffected by the high or low extremes. It remains the same even if the values at the ends change.
What is the mode and how does it differ from the mean and median?
-The mode is the value that appears most frequently in a data set. It differs from the mean and median as it focuses on the most common value rather than the average or middle value.
What are the different types of modality in a data set?
-A data set can be unimodal (one mode), bimodal (two modes), multimodal (more than two modes), or have no mode if all values appear with the same frequency.
How does the mode differ in a data set with no repeating values?
-In a data set with no repeating values, there is no mode because no value appears more frequently than the others.
What is the difference between measures of central tendency and measures of dispersion?
-Measures of central tendency provide a single value that represents the entire data set, identifying a central value around which data points cluster. Measures of dispersion, on the other hand, indicate how spread out the data points are, showing whether they are closely packed around the center or spread far from it.
Can you give an example of a measure of dispersion?
-Examples of measures of dispersion include standard deviation, range, and interquartile range. These measures help to understand the spread or variability within a data set.
Why are measures of central tendency and dispersion important in data analysis?
-Measures of central tendency and dispersion are important because they help to summarize and interpret data. Central tendency provides a central point, while dispersion describes how the data is spread around that center, giving insights into the data's variability and distribution.
Outlines
📊 Understanding Measures of Central Tendency
This paragraph introduces the concept of measures of central tendency, specifically focusing on the mean, median, and mode. The mean is defined as the sum of all observations divided by the number of observations, and an example is provided using test scores of five students, resulting in a mean score of 86.6. The median is explained as the middle value of a data set when arranged in ascending order, with special attention given to its resistance to outliers. The mode is described as the most frequently occurring value in a data set, with examples given for unimodal, bimodal, multimodal, and non-modal data sets. The paragraph ends with a brief comparison between measures of central tendency and measures of dispersion, highlighting their roles in representing a central value and describing the spread of data points, respectively.
Mindmap
Keywords
💡Measures of Central Tendency
💡Arithmetic Mean
💡Median
💡Mode
💡Outliers
💡Data Set
💡Resistant to Extreme Values
💡Unimodal, Bimodal, Multimodal
💡Measures of Dispersion
💡Blood Pressure
Highlights
Measures of central tendency include mean, median, and mode.
Arithmetic mean is calculated by dividing the sum of all observations by the number of observations.
Example given: Mean test score of five students is 86.6.
Median is the middle value in a data set when arranged in ascending order.
Median is resistant to extreme values or outliers.
Mode is the value that appears most frequently in a data set.
A dataset with one mode is called unimodal.
A dataset with two modes is called bimodal.
A dataset can be multimodal with more than two modes.
A dataset with no repeating values has no mode.
Measures of central tendency provide a single value representing the entire dataset.
Measures of dispersion, like standard deviation, indicate how spread out the data points are.
Central tendency measures help identify a central value around which data points cluster.
Measures of dispersion describe how the dataset is spread around the central point.
Video aims to explain the importance and application of measures of central tendency and dispersion.
Transcripts
Browse More Related Video
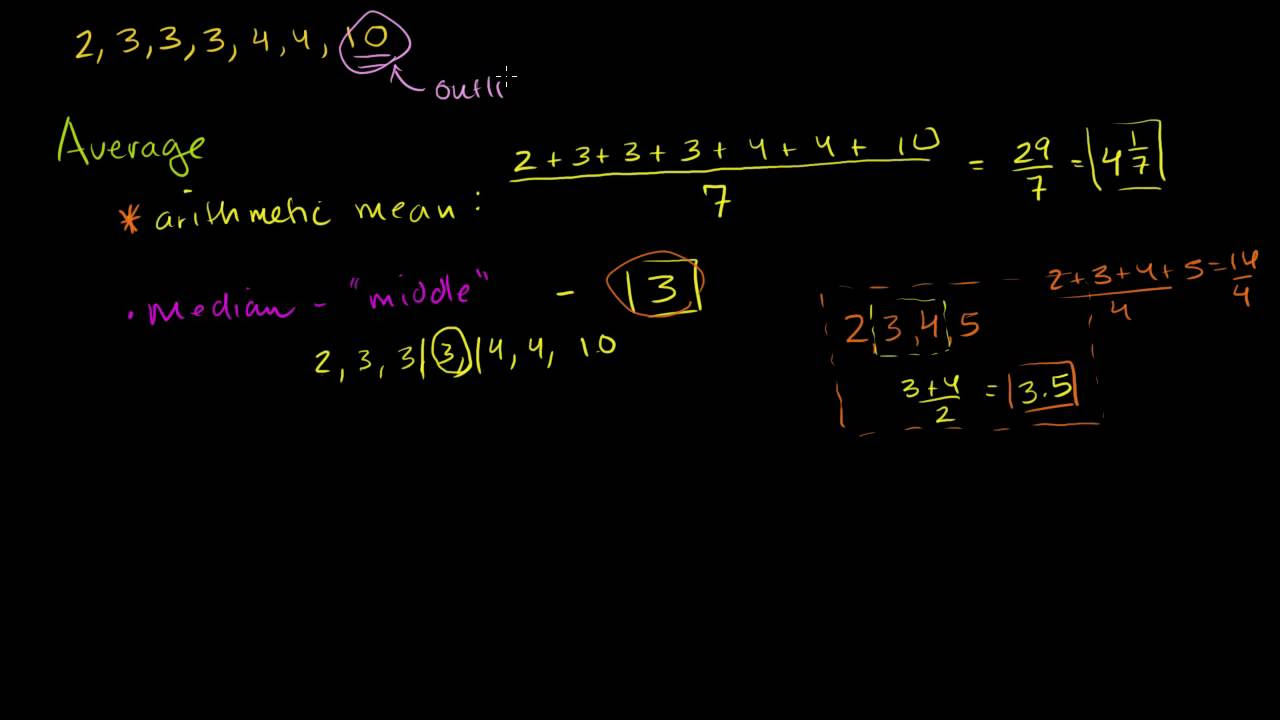
Finding mean, median, and mode | Descriptive statistics | Probability and Statistics | Khan Academy

Mode, Median, Mean, Range, and Standard Deviation (1.3)

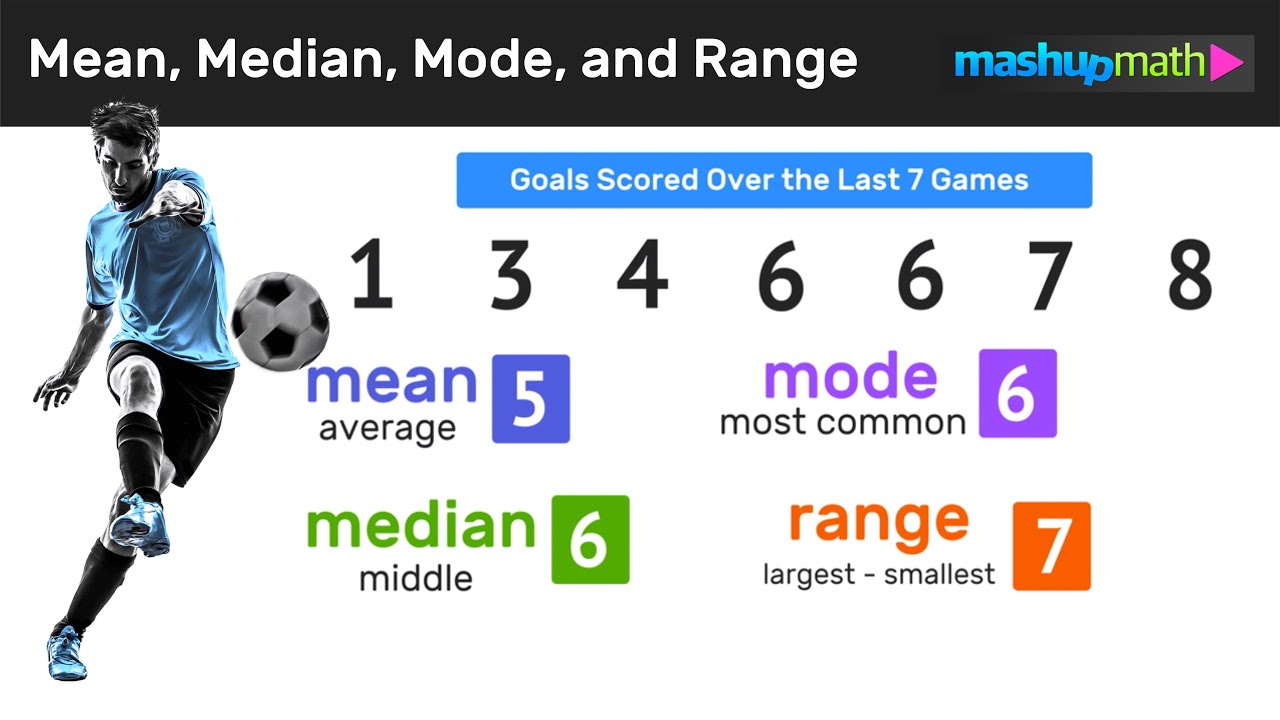
An Average Video | Mean, Median, Mode, and Range
Average or Central Tendency: Arithmetic Mean, Median, and Mode
How to Find the Mean, Median, Mode, and Range
Mean, Median, and Mode: Measures of Central Tendency: Crash Course Statistics #3
5.0 / 5 (0 votes)
Thanks for rating: