Measure of Central Tendency of Grouped Data for beginners
TLDRThis tutorial video guides beginners through calculating the mean, median, and mode for grouped data in statistics. It demonstrates the process step-by-step, starting with determining the mid-value of class intervals, then multiplying these by their respective frequencies to find the mean. The median is calculated by identifying the median class and applying a specific formula. Lastly, the mode is found by analyzing the class with the highest frequency and using a formula that involves differences in frequencies and class widths. The video concludes with a clear explanation of each step, ensuring viewers can apply these concepts to their own data analysis.
Takeaways
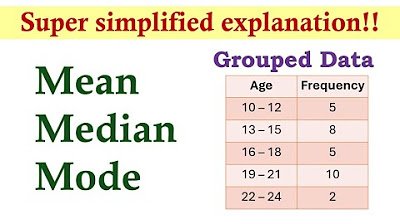
- 📊 The tutorial is focused on explaining the calculation of mean, median, and mode for grouped data in statistics.
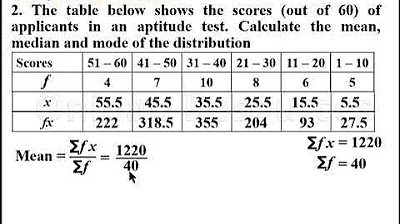
- 🔢 To calculate the mean, the formula used is the sum of the product of frequency (f) and mid-value (x) divided by the total frequency.
- 📈 The mid-value (x) for each class interval is found by adding the lower and upper class limits and dividing by 2.
- 📚 The script provides a step-by-step example of calculating the mean, including creating a column for mid-values and the FX product.
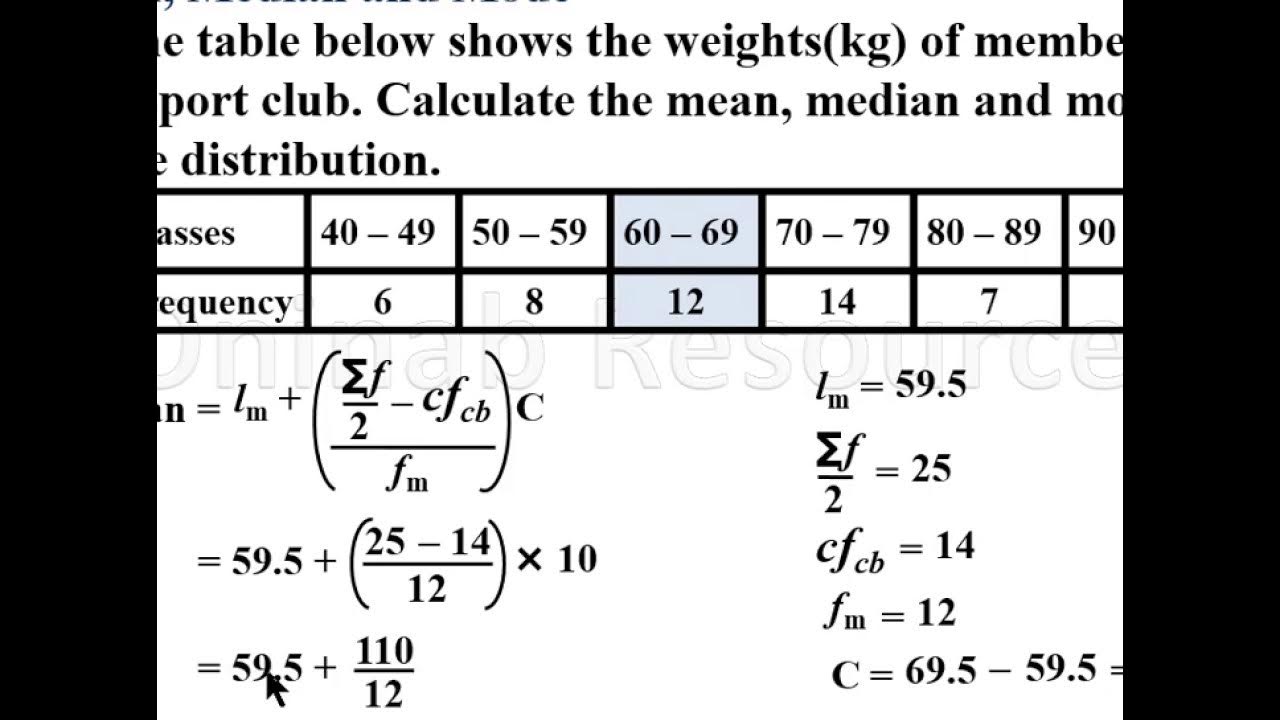
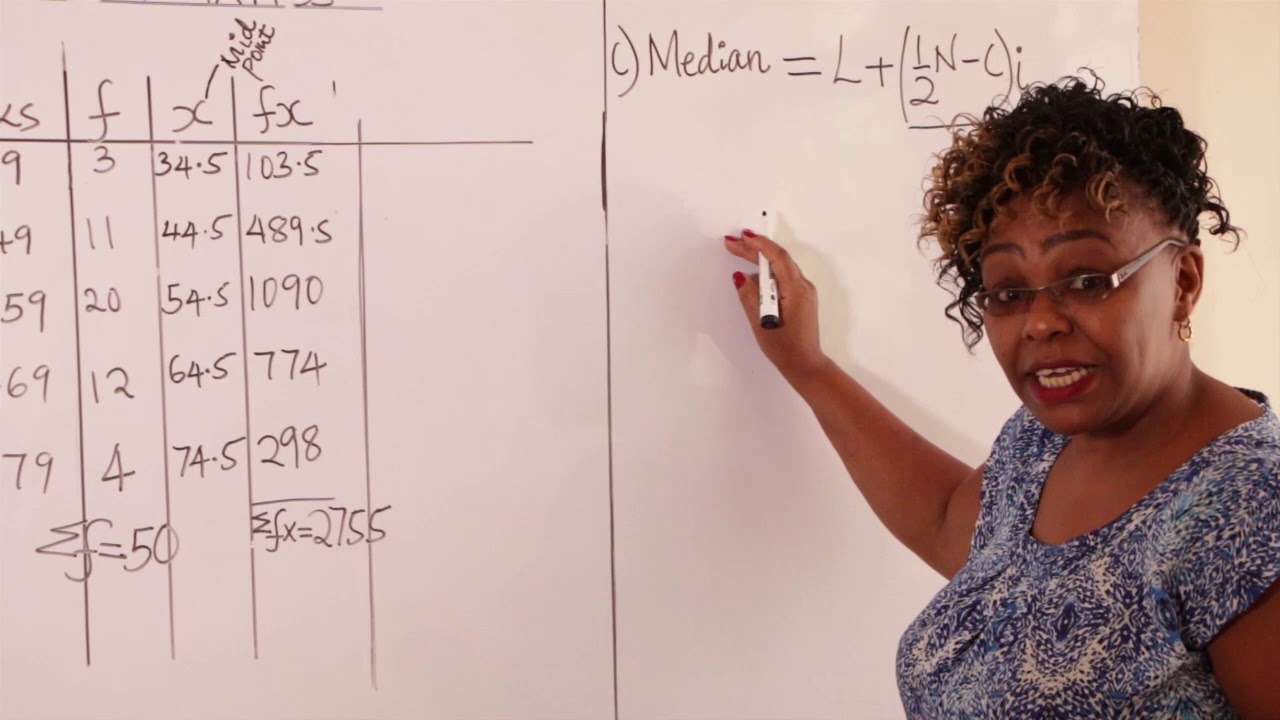
- 📉 To find the median, the formula involves the lower class boundary of the median class, adjusted by the cumulative frequency and class width.
- 📝 Cumulative frequency is calculated by summing the frequencies of all preceding class intervals.
- 🔎 The median class is identified by finding the class interval where the cumulative frequency first exceeds half of the total frequency.
- 📋 The mode is calculated by determining the class with the highest frequency and using a formula that adjusts the lower class boundary based on differences in frequencies of adjacent classes.
- 📉 The class width is the same for each interval in this example, simplifying the calculation of the median and mode.
- 📌 The tutorial includes a detailed example with calculations for each step, providing clarity on how to approach grouped data statistics.
- 👍 The presenter encourages viewers to like, share, and subscribe to the YouTube channel for more educational content.
Q & A
What is the main topic of the tutorial video?
-The main topic of the tutorial video is statistics, specifically focusing on calculating the mean, median, and mode of grouped data for beginners.
What is the formula used to calculate the mean of grouped data?
-The formula used to calculate the mean of grouped data is the sum of the product of frequency (f) and mid-value (x), divided by the sum of the frequencies (Σfx / Σf).
How is the mid-value (x) of a class interval determined?
-The mid-value (x) of a class interval is determined by adding the lower and upper class limits and dividing by 2.
What does the term 'FX' represent in the context of the video?
-In the context of the video, 'FX' represents the product of the frequency (f) and the mid-value (x) of a class interval.
What is the median class in the context of calculating the median?
-The median class is the class interval that contains the value which is exactly in the middle of the dataset when ordered by frequency.
How is the lower class boundary of the first class interval calculated?
-The lower class boundary of the first class interval is calculated by taking the mid-value between the assumed lower limit (1) and the actual lower limit of the first interval (11), which is (1+11)/2 = 6.
What is the formula for calculating the median of grouped data?
-The formula for calculating the median of grouped data involves the lower class boundary of the median class, the cumulative frequency, the frequency of the median class, and the class width.
What is the purpose of calculating the cumulative frequency?
-The purpose of calculating the cumulative frequency is to determine the total number of observations up to a certain class interval, which is crucial for finding the median class.
How is the mode of the grouped data calculated?
-The mode is calculated by finding the class interval with the highest frequency, then using the lower class boundary of that class, along with the differences in frequencies (Δ1 and Δ2) and the class width to determine the exact mode.
What is the difference between Δ1 and Δ2 in the mode calculation formula?
-Δ1 is the positive difference between the frequency of the modal class and the class before it, while Δ2 is the positive difference between the frequency of the modal class and the class after it.
Outlines
📊 Introduction to Grouped Data Statistics
This paragraph introduces a tutorial on statistics, focusing on calculating the mean, median, and mode for grouped data. It explains the initial setup, including the frequency and age range columns, and the process of calculating the mean by creating additional columns for the mid-value of each class interval. The tutorial demonstrates the calculation of the mid-values for different age groups, such as 11-20, 21-30, and so on, up to 71-80, and then proceeds to the calculation of the FX column, which is the product of frequency and mid-value for each class interval.
🧮 Calculating the Mean and Median
The paragraph continues with the calculation of the mean by summing up the FX column and dividing by the total frequency, resulting in the mean age of the distribution. It then moves on to the calculation of the median, introducing the formula and explaining the need for additional columns for lower class boundaries and cumulative frequency. The process involves identifying the median class based on the cumulative frequency and calculating the median using the lower class boundary, the cumulative frequency before the median class, and the class width.
📈 Determining the Lower Class Boundaries and Cumulative Frequencies
This section delves into the specifics of determining the lower class boundaries for each interval and calculating the cumulative frequencies. It explains how to find the lower boundary for the first class interval and subsequent intervals by averaging the upper and lower bounds of the intervals. The paragraph also details the creation of the cumulative frequency column, starting from an assumed interval before the first class with a frequency of zero, and incrementally adding the frequencies of each class interval to find the cumulative total.
📊 Finding the Median and Mode of the Distribution
The final paragraph concludes the tutorial by calculating the median and mode of the data distribution. It describes how to find the median class by dividing the total frequency by two and identifying the class interval with a cumulative frequency just greater than this value. The median is then calculated using the formula provided, taking into account the lower class boundary, the frequency before the median class, and the class width. The paragraph also explains how to determine the mode by identifying the class with the highest frequency, calculating the differences between frequencies of adjacent classes, and applying the mode formula to find the modal value.
Mindmap
Keywords
💡Statistics
💡Mean
💡Median
💡Mode
💡Grouped Data
💡Class Interval
💡Frequency
💡Mid-Value
💡Cumulative Frequency
💡Class Width
Highlights
Introduction to a tutorial on statistics focusing on mean, median, and mode for grouped data beginners.
Explanation of the formula for calculating the mean using the summation of frequency times the mid-value (FX) divided by the total frequency (F).
Demonstration of finding the mid-value for each class interval by averaging the lower and upper class limits.
Step-by-step calculation of the mid-value for the age groups 11-20, 21-30, and so on, up to 71-80.
Creation of an FX column to multiply the frequency by the mid-value for each class interval.
Summation of the FX column and the frequency column to calculate the mean of the distribution.
Introduction of the median calculation process for grouped data.
Explanation of the median formula involving the lower class boundary, cumulative frequency, and class width.
Calculation of the lower class boundary for each interval, including the interval before the first class.
Creation of a cumulative frequency column to assist in finding the median class.
Identification of the median class based on the cumulative frequency greater than half the total frequency.
Calculation of the median using the lower class boundary of the median class, the cumulative frequency before, and the class width.
Introduction to the mode calculation for grouped data.
Explanation of the mode formula involving the lower class boundary of the modal class, differences in frequency (Delta 1 and Delta 2), and class width.
Identification of the modal class as the one with the highest frequency.
Calculation of Delta 1 and Delta 2 to find the mode using the provided formula.
Final calculation of the mode as 43, representing the most frequent age group in the distribution.
Conclusion of the tutorial with an invitation to like, share, and subscribe for more content.
Transcripts
Browse More Related Video
Mean, Median and Mode of Grouped Data(Lesson 2)
Mean, median and mode of grouped Data(Lesson 1)
FORM 2 MATHS STATISTICS I MEAN,MODE & MEDIAN
Measures of Central Tendency (Grouped Data) | Basic Statistics

Statistics - Mean, Median & Mode for a grouped frequency data

Statistics of Grouped Data: Mean, Median and Mode
5.0 / 5 (0 votes)
Thanks for rating: