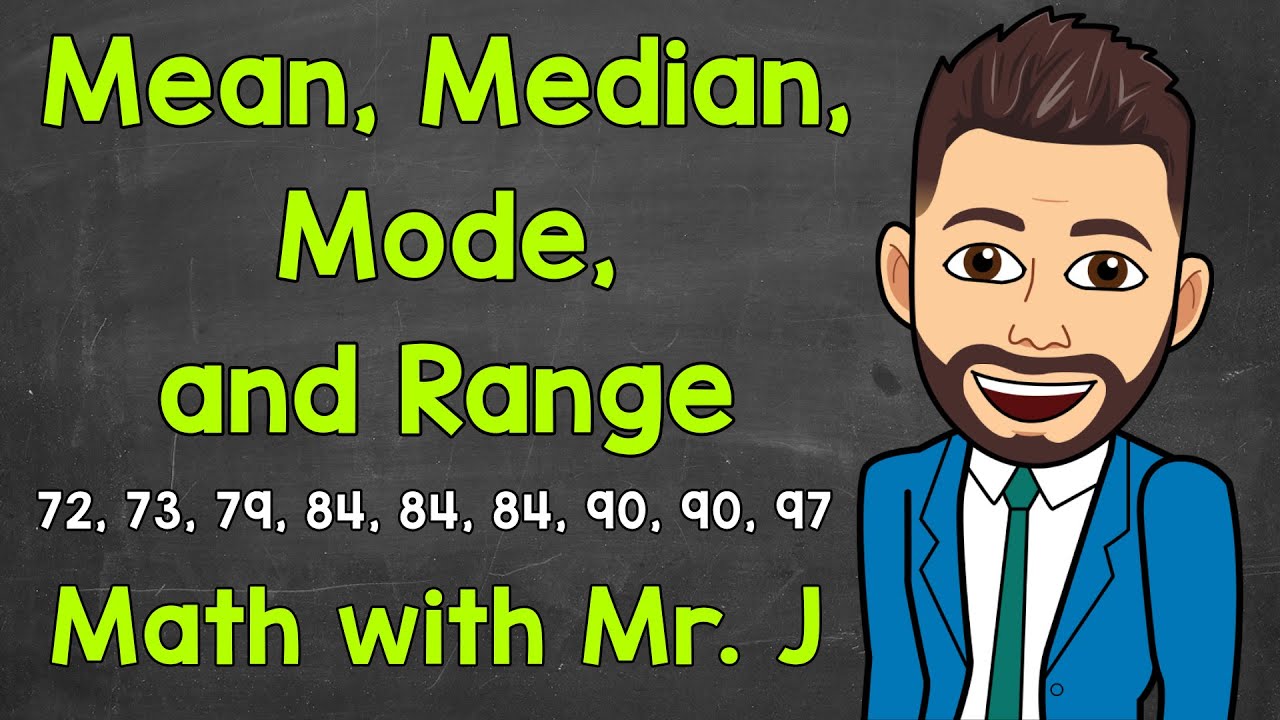
Mean, Median, Mode, and Range using Legos
TLDRThis educational video creatively uses Legos to illustrate the concepts of mean, median, mode, and range. The presenter organizes Legos by stud count, calculates the mean by dividing total studs by the number of pieces, determines the median by identifying the middle value in the ordered set, identifies the mode as the most frequent stud count, and calculates the range as the difference between the highest and lowest stud counts. The video also encourages viewers to suggest alternative items for teaching these statistical measures and invites them to subscribe for more math content.
Takeaways
- 📚 The video demonstrates how to calculate mean, median, mode, and range using Legos as a visual aid.
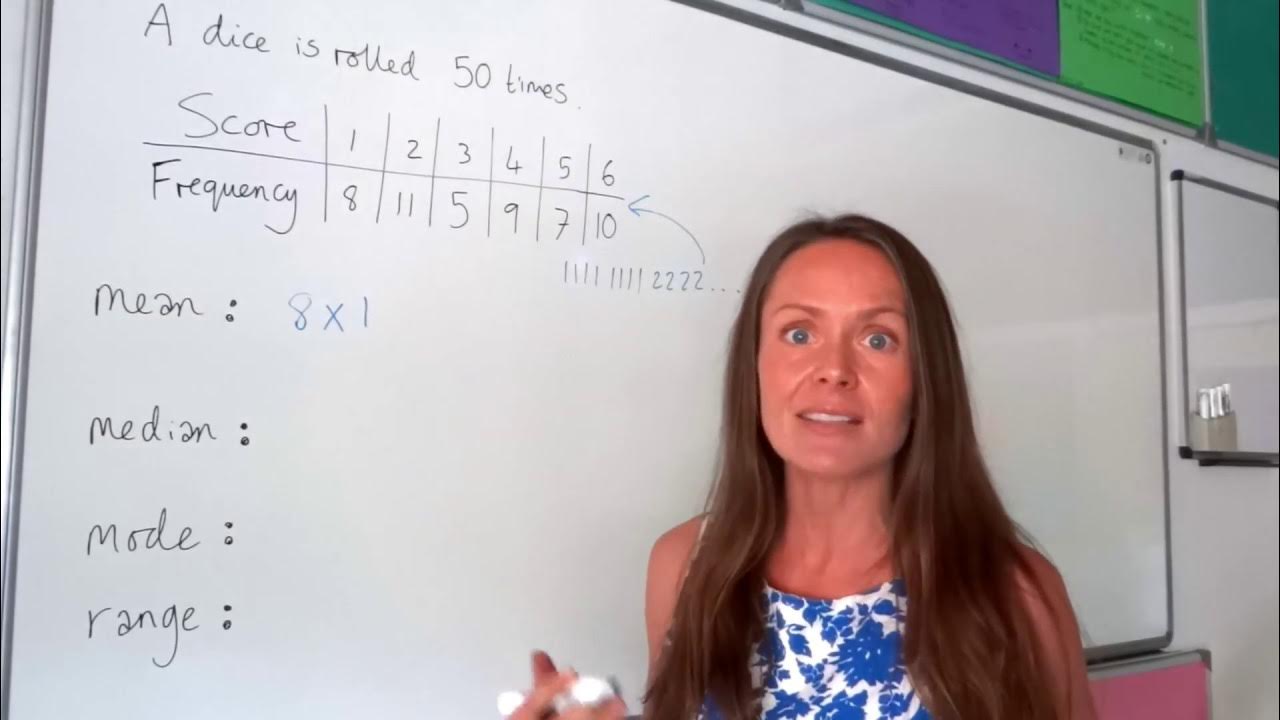
- 🔢 The mean is calculated by summing all the studs on the Legos and dividing by the number of Lego pieces.
- 🎵 The script uses music to transition between different steps of the calculation process.
- 🔄 The Legos are arranged from least to greatest by the number of studs to facilitate the calculation of median and range.
- 🏁 The median is the middle value of the ordered Legos, found by removing Legos from the ends until the middle is reached.
- 📈 The mode is the number that occurs most frequently among the Legos' stud counts.
- 📊 The range is determined by subtracting the lowest stud count from the highest stud count.
- 🤔 The video encourages viewers to think of other items that could be used to demonstrate mean, median, mode, and range.
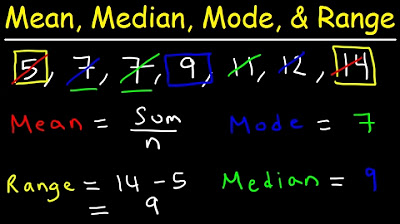
- 📈 In the first example, the mean is 4, the median is 3, the mode is 2, and the range is 7.
- 📊 In the second example, the mean is approximately 5.3, the median is 6, the mode is both 4 and 6, and the range is 9.
- 🔔 The video ends with a call to action for viewers to subscribe for more math videos and to enable notifications.
Q & A
What is the main topic of the video?
-The main topic of the video is explaining the concepts of mean, median, mode, and range using Legos as an example.
How does the video demonstrate the process of finding the mean?
-The video demonstrates finding the mean by adding up all the studs on the Legos and dividing by the total number of Lego pieces to get the average.
What is the median in the first example with 12 Lego pieces?
-In the first example, the median is 3, which is the middle value after arranging the Legos in order from least to greatest.
How is the mode identified in the video?
-The mode is identified by counting the number that occurs the most. In the first example, the mode is 2, as it occurs four times.
What is the range in the first example of the video?
-The range in the first example is 7, which is the difference between the highest value (8) and the lowest value (1).
In the second problem, what is the mean of the Lego pieces?
-In the second problem, the mean is approximately 5.3, obtained by dividing the total number of studs (111) by the number of Lego pieces (21).
What is the median in the second example with 21 Lego pieces?
-In the second example, the median is 6, which is the middle value after arranging the Legos and removing the ones from the outsides.
What are the modes in the second example of the video?
-In the second example, there are two modes: 4 and 6, as both occur six times.
What is the range in the second example of the video?
-The range in the second example is 9, which is the difference between the highest value (10) and the lowest value (1).
What does the video encourage viewers to do at the end?
-The video encourages viewers to think of other items that can be used to demonstrate mean, median, mode, and range, and to subscribe for more math videos and click the bell for notifications.
Outlines
📚 Introduction to Mean, Median, Mode, and Range with Legos
This paragraph introduces a video that teaches the concepts of mean, median, mode, and range using Legos as a visual aid. The presenter explains the process of arranging Legos by the number of studs, from least to greatest, and then counts these studs to find the total. The mean is calculated by dividing the total number of studs by the number of Lego pieces. The median is identified as the middle value in the ordered set, and the mode is the most frequently occurring number of studs. The range is determined by subtracting the lowest value from the highest. The video demonstrates these calculations with two sets of Legos, showing how to find the mean as 4 and 5.3, the median as 3 and 6, the mode as 2 and both 4 and 6, and the range as 7 and 9, respectively.
🤔 Exploring Alternatives to Legos for Statistical Concepts
The second paragraph extends an invitation for suggestions on other items that could be used to understand mean, median, mode, and range, besides Legos. It encourages viewers to think creatively about everyday objects that could serve as teaching tools for these statistical measures. The paragraph ends with a reminder for viewers to subscribe for more math-related content and to enable notifications for updates, promising to see them in the next video.
Mindmap
Keywords
💡Mean
💡Median
💡Mode
💡Range
💡Lego
💡Studs
💡Ordered
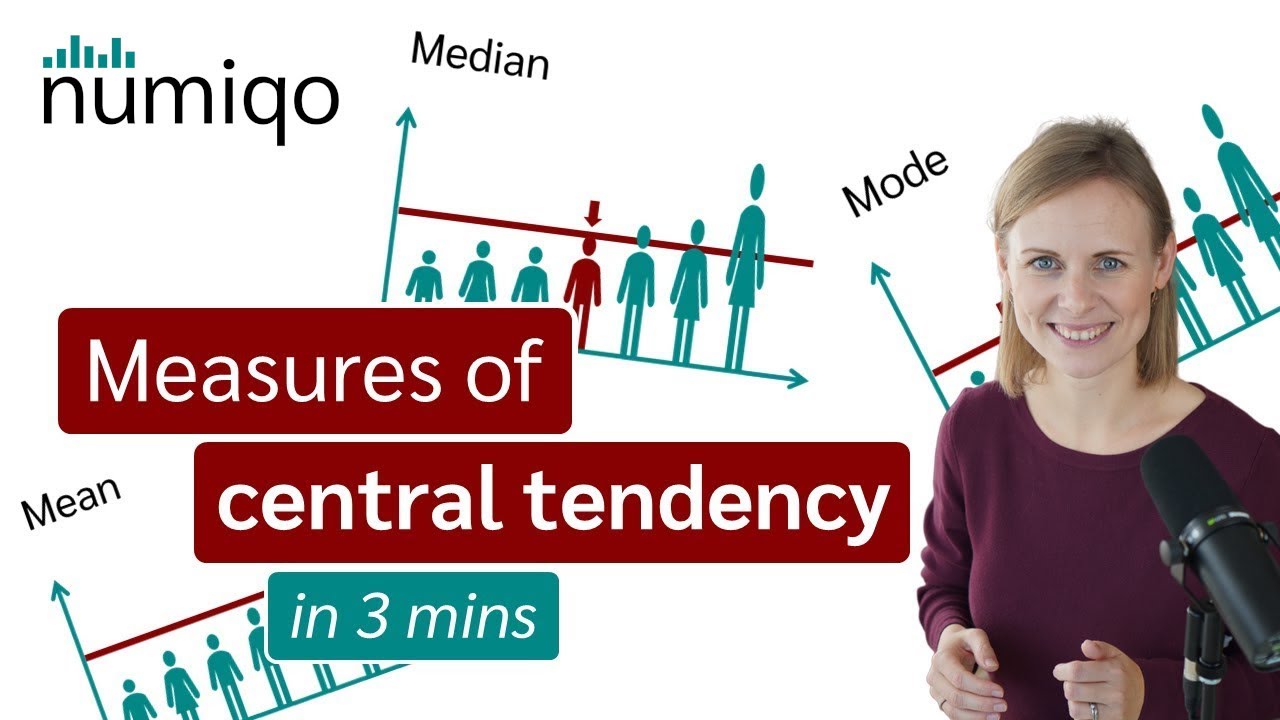
💡Measure of Central Tendency
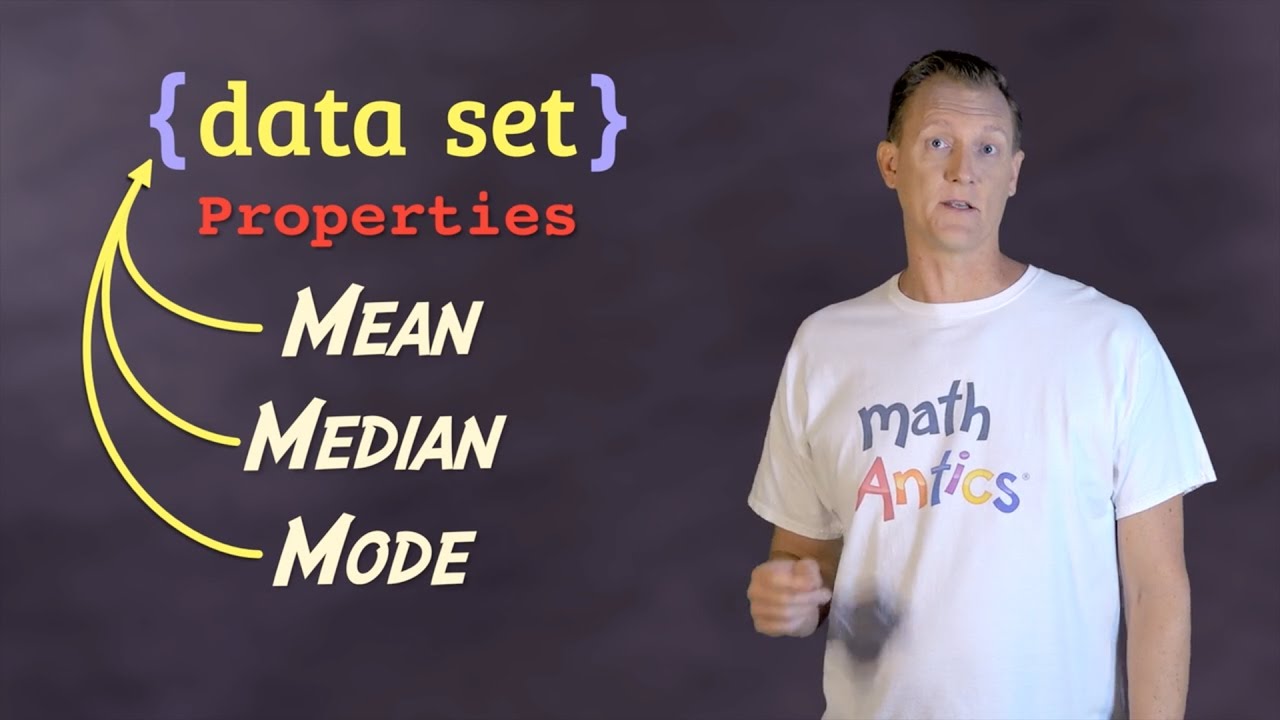
💡Data Set
💡Decimal
💡Contextualize
Highlights
Introduction to the educational video using Legos to illustrate statistical concepts.
Explanation of the process to determine the mean by counting studs on Legos and dividing the total by the number of pieces.
Demonstration of finding the mean, which is calculated to be 4 for the first set of Legos.
Description of how to find the median by ordering Legos and identifying the middle value.
Reveal that the median for the first set of Legos is 3, determined by the middle value between two Legos.
Introduction to the mode as the most frequently occurring number in a set, shown with the number 2 occurring four times.
Calculation of the range as the difference between the highest and lowest values, resulting in 7 for the first set.
Presentation of a second problem with a larger set of Legos to illustrate the statistical concepts.
Calculation of the mean for the second set of Legos, which rounds to approximately 5.3.
Identification of the median for the second set as 6, the single middle value after ordering the Legos.
Introduction of the concept of multiple modes, with both 4 and 6 occurring six times each in the second set.
Explanation of calculating the range for the second set, which is 9, the difference between the highest and lowest values.
Engagement with the audience by asking for suggestions of other items that could be used to teach mean, median, mode, and range.
Encouragement for viewers to subscribe for more math videos and to enable notifications for updates.
Anticipation of the next video in the series, creating a sense of continuity and engagement.
Transcripts
Browse More Related Video
5.0 / 5 (0 votes)
Thanks for rating: