Mean, Median, and Mode of Grouped Data & Frequency Distribution Tables Statistics
TLDRThe video explains how to calculate the mean and determine the median and mode for a group frequency distribution table showing the grades or weights of students. It goes through the steps to find the midpoints of each interval, multiply the frequencies by the midpoints, sum those products, and divide by the total frequency to estimate the mean. It also shows how to construct a cumulative frequency column to locate the median and note which interval has the highest frequency for the mode. Examples demonstrate these calculations and interpretations for grade and weight distributions across different intervals.
Takeaways
- 😀 To estimate mean for a group frequency table, take sum of (frequency x midpoint) divided by total frequency
- 😊 Midpoint is calculated by taking (lower boundary + upper boundary) / 2 for each interval
- 💡 Cumulative frequency helps determine which interval contains median
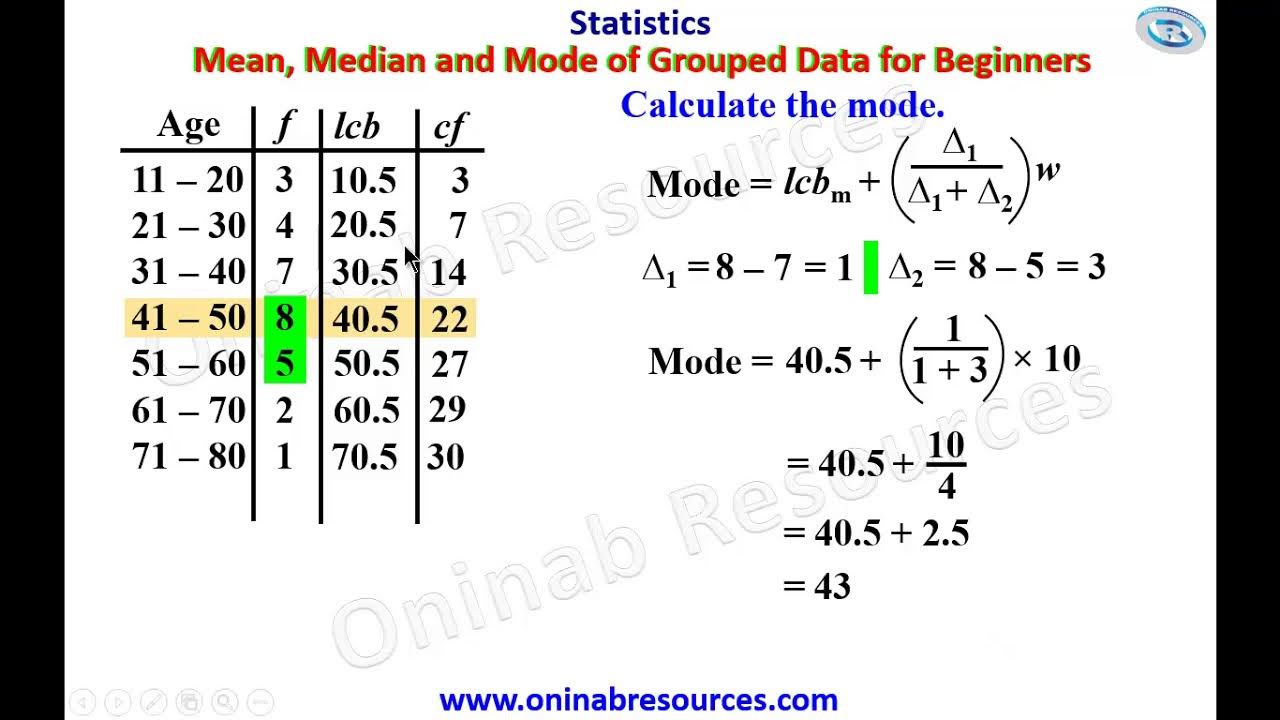
- 📈 Mode exists in interval with highest frequency
- 🔍 Median is located where cumulative frequency reaches half of total frequency
- 🧮 Work through example by calculating midpoints, frequency x midpoint, cumulative frequencies
- 📊 Before calculating mean, predict which interval it will likely fall in based on data distribution
- 🤔 Compare mean, median and mode locations to understand shape of distribution
- ✏️ Practice calculating measures of central tendency for group frequency data through additional example
- 🙌 Applying process systematically makes solving these problems achievable
Q & A
Why can't we compute an exact mean for the grades in the frequency table?
-We can't compute an exact mean because we only have grade ranges and frequencies, not the individual student grades. We would need the actual data values for each student to calculate an exact mean.
What is the formula used to estimate the mean for a frequency table?
-The formula is: Mean = Sum of (Frequency x Midpoint) / Sum of Frequencies
How do you calculate the midpoint for a grade interval?
-To calculate the midpoint, add the lower boundary of the interval to the upper boundary and divide by 2.
Where is the mean grade likely located based on the frequency table?
-The mean grade is likely located in the 70-79 interval since that interval has the highest frequency of students.
Where are the median and mode located in the grade distribution?
-The mode exists in the 70-79 interval, which has the highest frequency. The median is also located in the 70-79 interval.
What does the cumulative frequency column in the weight table represent?
-The cumulative frequency column shows the running total of frequencies up to and including that interval.
Which interval does the calculated mean weight fall into?
-The calculated mean weight of 165.7 falls into the 160-179 lbs interval.
Why is the calculated mean closer to 160 than 179?
-More of the data is concentrated on the left side of the distribution, so the mean is pulled closer to 160.
Which interval contains both the median and mode student weights?
-The interval from 160-179 lbs contains both the median and mode.
How do you determine which interval contains the median?
-Look at the cumulative frequency to see which interval contains the middle data value. Half of 36 students is 18, which falls in the 160-179 interval.
Outlines
📈 Calculating Mean from Group Frequency Table
This paragraph explains how to calculate the mean test score for a group of 38 students using a frequency table showing grade intervals and the number of students in each interval. It introduces the formula for estimating mean from a group frequency table, walks through calculating midpoints for each interval, sums the frequencies, calculates frequency x midpoint products, sums those products, then divides by total frequency to estimate the mean score.
💯 Estimating Mean, Median and Mode Intervals
This paragraph continues the example by estimating which interval contains the mean test score based on the frequencies. It then explains how to use the cumulative frequencies to identify the interval containing the median score, and notes the mode is the interval with the highest frequency. It sets up another example with weight intervals for practice.
📊 Solving Mean, Median and Mode for Weight Data
This paragraph works through the weight frequency table example introduced in the previous paragraph. It calculates cumulative frequencies, midpoints, frequency x midpoint products to ultimately solve for the estimated mean weight. It also identifies which intervals contain the median and mode based on cumulative frequencies and highest frequency interval respectively.
Mindmap
Keywords
💡frequency
💡midpoint
💡mean
💡median
💡mode
💡interval
💡boundary
💡cumulative frequency
💡distribution
💡central tendency
Highlights
We cannot compute an exact mean for the grades because we don't know the individual data values.
The mean for a frequency table is the sum of the products of frequency and midpoint, divided by the sum of frequencies.
The midpoint is calculated as the average of the lower and upper boundaries of an interval.
The mean will likely be in the interval with the highest frequency since that's where most data lies.
The mode exists in the interval with the highest frequency.
The median is found by calculating cumulative frequencies to find the middle data point.
Heavier data on the left side will pull the mean towards the lower intervals.
The mode is the interval with the highest frequency.
The median is found by identifying which interval contains the middle data point based on cumulative frequencies.
Highlight 10
Highlight 11
Highlight 12
Highlight 13
Highlight 14
Highlight 15
Transcripts
Browse More Related Video
5.0 / 5 (0 votes)
Thanks for rating:


