Sketching a Derivative from the Graph of a Function
TLDRThe video script is a tutorial on how to graph the derivative of a function, emphasizing the importance of identifying key features such as stationary points and points of inflection. It suggests using different colors and tools like rulers for clarity. The instructor guides through the process of differentiating, plotting stationary points, and determining whether the function is increasing or decreasing. They also discuss the implications of asymptotes and how they affect the derivative's behavior, including horizontal and oblique asymptotes, and the approach of the gradient as x approaches infinity.
Takeaways
- 📏 Use a ruler and different colored pencils or pens to differentiate between the original function and its derivative.
- 📚 Identify stationary points on the original function, as these indicate where the first derivative (f') should be zero.
- 🔍 Differentiate between increasing and decreasing intervals on the original function to understand the behavior of the derivative.
- 📈 Label the graph of the original function with plus signs to indicate increasing intervals and minus signs for decreasing intervals.
- 📉 Recognize that a turning point on the original function will result in a change from positive to negative or vice versa on the derivative graph.
- 🔺 Sketch the derivative function to pass through regions that reflect the increasing and decreasing behavior of the original function.
- 🔄 Be aware of points of inflection on the original function, as these will correspond to stationary points on the derivative function.
- 📍 If there's an inflection point, ensure the derivative graph reflects this with a change in concavity.
- 💡 Consider the behavior of the derivative as x approaches infinity, especially if there are asymptotes involved in the original function.
- 🔄 If there's an oblique asymptote, the derivative will approach a constant value rather than zero as x approaches infinity.
- 🔍 Pay attention to the language used to describe stationary points and points of inflection to avoid confusion with other features on the graph.
Q & A
What is the main focus when drawing the derivative of a function?
-The main focus is to identify and locate the stationary points, as the first derivative should be zero at these points.
Why is it helpful to use a different color or dot lines when drawing the derivative?
-Using a different color or dot lines helps distinguish the derivative from the original function, making it easier to visualize and understand the changes in the function's slope.
What tool is suggested for drawing the derivative to ensure accuracy?
-A ruler is suggested to ensure straight lines and accurate positioning of the derivative relative to the stationary points.
What information does the first derivative provide about the original function?
-The first derivative provides information about whether the original function is increasing or decreasing at different points.
How can you determine if a function is increasing or decreasing to the left of a stationary point?
-You can determine if the function is increasing or decreasing by observing the sign of the first derivative: a positive slope indicates an increasing function.
What is the significance of a point of reflection in the context of the derivative?
-A point of reflection in the original function indicates a potential change in the concavity of the function, which should be reflected in the derivative as a stationary point.
What is the process for sketching the derivative between stationary points?
-The process involves identifying whether the function is increasing or decreasing between the stationary points and sketching a curve that reflects these changes in slope.
How does the presence of an asymptote affect the behavior of the derivative?
-The presence of an asymptote, especially an oblique one, affects the behavior of the derivative by causing the gradient to approach a constant value rather than zero as x approaches infinity.
What is the significance of the gradient approaching zero as x approaches infinity?
-The gradient approaching zero indicates that the function is decreasing and getting closer to the x-axis as x becomes very large.
What is a common mistake to avoid when labeling the derivative graph?
-A common mistake to avoid is confusing a stationary point in the derivative with a point of reflection in the original function; they signify different things.
Why is it important to consider the behavior of the function and its derivative at infinity?
-Considering the behavior at infinity is important because it gives insights into the long-term trends of the function and its derivative, such as whether the gradient approaches a constant or zero.
Outlines
📚 Understanding Derivatives and Graphs
This paragraph discusses the process of differentiating a function and graphing its derivative, f'(x). The speaker emphasizes the importance of identifying stationary points where the derivative equals zero, and suggests using a ruler and different colors for clarity. They also mention the significance of the first derivative's sign in determining whether the function is increasing or decreasing. The speaker illustrates how to label these regions on the graph of f(x) and hints at the presence of a point of inflection, which is a feature of the second derivative. The paragraph concludes with a caution about distinguishing between different types of stationary points and the importance of symmetry in cubic functions.
🔍 Analyzing the Behavior of Derivatives at Infinity
In this paragraph, the focus shifts to the behavior of the derivative as x approaches infinity. The speaker explores how the gradient of the function behaves in this limit, noting that it approaches zero if the function is decreasing without bound. They also discuss the implications of an oblique asymptote on the gradient's behavior at infinity, where the gradient would approach a positive constant instead of zero. The speaker illustrates this with a hypothetical scenario, adding stationary points and an inflection point to the graph to reflect these changes. The paragraph ends with a consideration of horizontal asymptotes and the approach of the function and its derivative to zero or a constant value.
Mindmap
Keywords
💡Derivative
💡Stationary Points
💡First Derivative
💡Increasing/Decreasing
💡Gradient
💡Point of Inflection
💡Asymptote
💡Concave Up/Down
💡Symmetry
💡Horizontal Asymptote
💡Oblique Asymptote
Highlights
Introduction to the process of differentiating a function and drawing its derivative.
Importance of using a ruler and different colors for clarity when drawing the derivative.
Identifying stationary points as a key feature for understanding the first derivative.
Explanation that the first derivative should be zero at stationary points.
Technique of using dot lines for differentiating and the use of an extra sheet of paper for clarity.
Process of differentiating and drawing the derivative between stationary points.
Understanding the behavior of the derivative in terms of increasing or decreasing functions.
Labeling the graph of the function to indicate whether it's increasing or decreasing.
Differentiating between the types of stationary points and their implications on the derivative.
Drawing the derivative to reflect the function's behavior between stationary points.
Explanation of the point of reflection and its effect on the derivative.
Adding features like stationary points and inflection points to the derivative graph.
Handling asymptotes and their impact on the derivative's behavior.
Adding a new stationary point and its effect on the derivative graph.
Approach of the derivative as x approaches infinity and its implications.
Differentiating between a horizontal asymptote and the behavior of the derivative.
Final adjustments to the derivative graph to reflect the function's complete behavior.
Discussion on the approach of the derivative to zero in the context of a straight line.
Concluding remarks on the complexity of the graph and the importance of careful differentiation.
Transcripts
Browse More Related Video
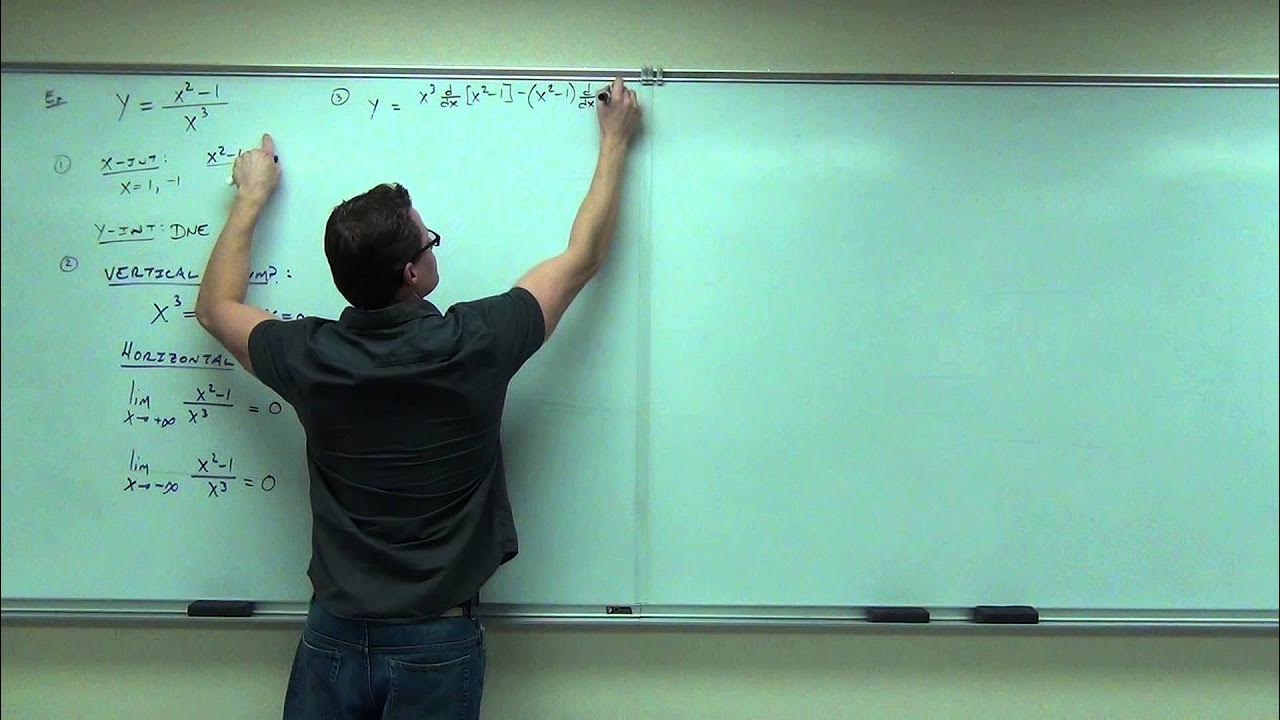
Calculus 1 Lecture 3.6: How to Sketch Graphs of Functions
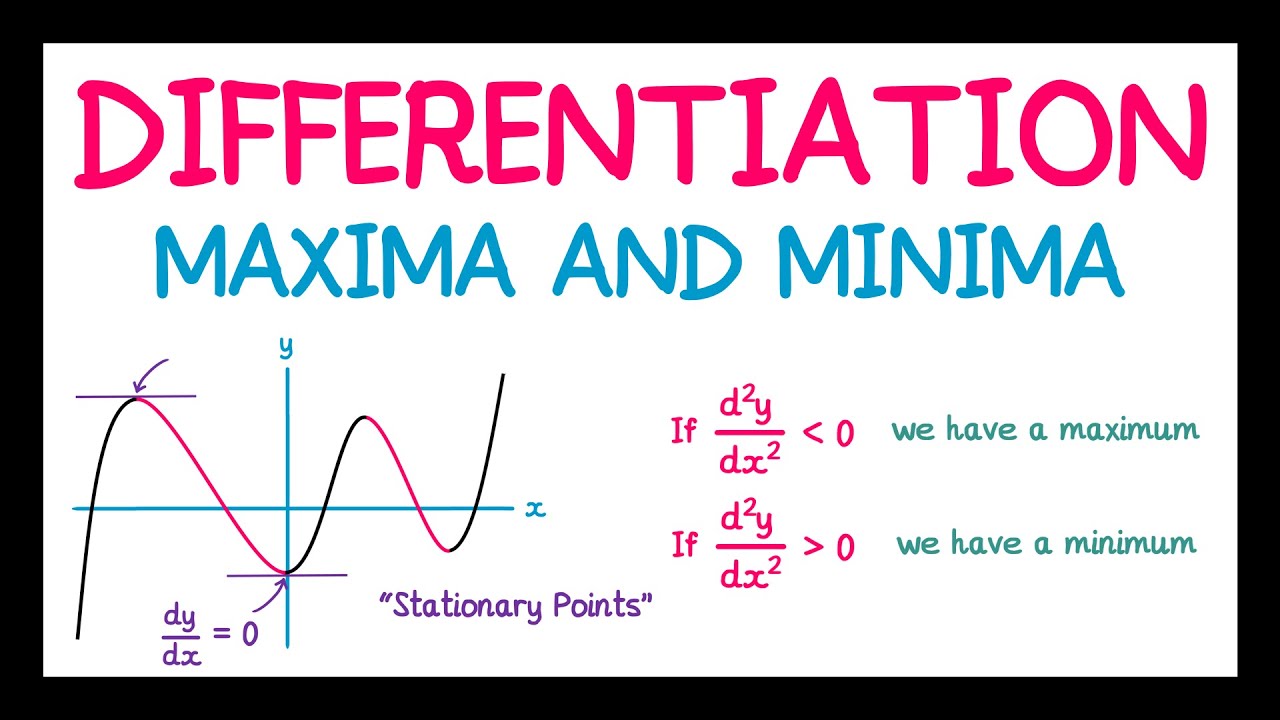
Differentiation (Maxima and Minima)
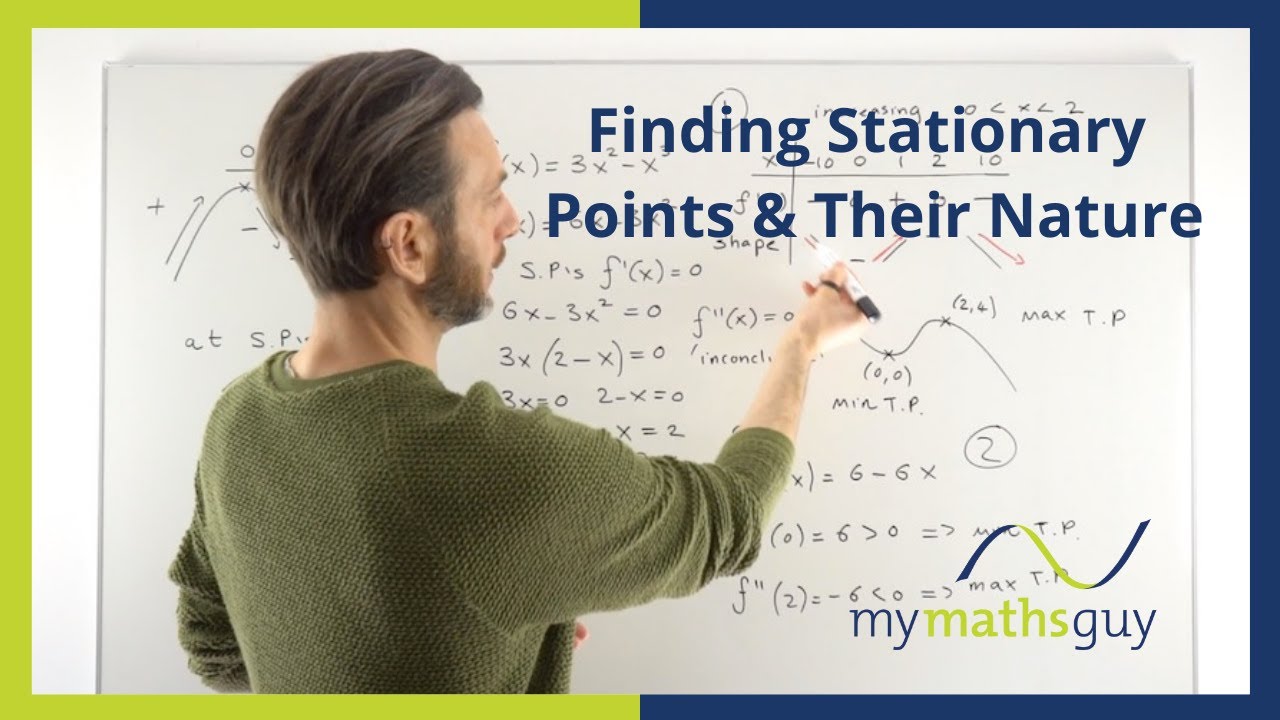
Finding Stationary Points and Determining their Nature
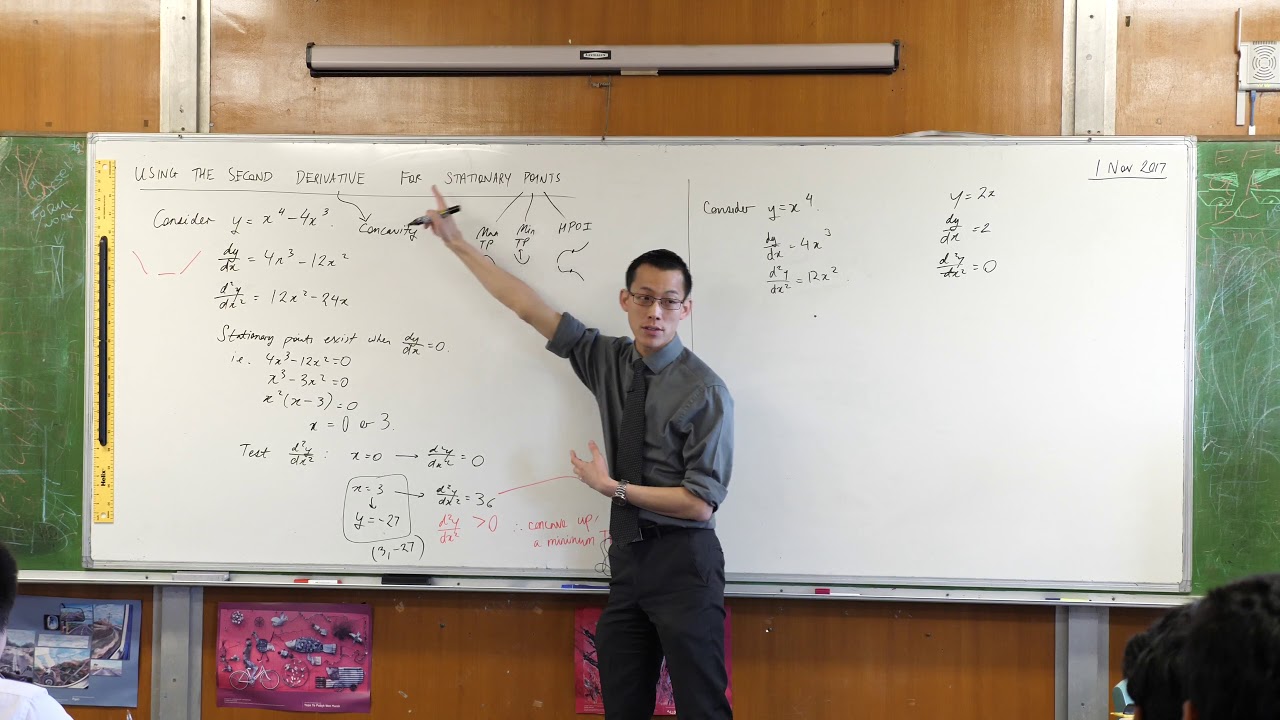
Using the Second Derivative (2 of 2: Determining nature of stationary points)
Concavity, Inflection Points, Increasing Decreasing, First & Second Derivative - Calculus

Using the Second Derivative (3 of 5: Why the Points of Inflexion may not exist when f"(x) = 0)
5.0 / 5 (0 votes)
Thanks for rating: