Margin of error 1 | Inferential statistics | Probability and Statistics | Khan Academy
TLDRThe video script discusses a hypothetical scenario of a presidential election in a country with 100 million people, where voters choose between two candidates, A and B. It uses a Bernoulli Distribution to model the voting behavior, where voting for A is represented by 0 and for B by 1. The mean of this distribution is p, the probability of voting for B. Due to the impracticality of surveying the entire population, a random sample of 100 people is taken to estimate p. The sample mean and variance are calculated, leading to an estimated p of 43% for candidate B. The script then explores the concept of sample standard deviation and introduces the idea of constructing a confidence interval to gauge the accuracy of the sample in representing the entire population's voting intentions.
Takeaways
- 🗳️ The script discusses a hypothetical presidential election scenario in a country with 100 million people and two candidates, A and B.
- 📊 It introduces the concept of a Bernoulli Distribution to model the binary outcome of voting for either candidate A (0) or candidate B (1).
- 🧐 The mean of the Bernoulli Distribution is established as 'p', representing the probability that a randomly selected individual will vote for candidate B.
- 🔍 Due to the impracticality of surveying 100 million people, the script suggests estimating 'p' through a random sample of the population.
- 🔢 A sample of 100 people is taken, with 57 indicating they would vote for A and 43 for B, leading to a sample mean calculation of 0.43.
- 📐 The sample variance is calculated using the formula, resulting in an estimate of 0.2475, which is then used to estimate the population variance.
- 📏 The sample standard deviation is derived from the square root of the sample variance, estimated to be approximately 0.50.
- 🌐 The script discusses the concept of the sampling distribution of the sample mean and its properties, such as its mean and standard deviation.
- 🔄 An estimate for the standard deviation of the sampling distribution of the sample mean is calculated using the sample standard deviation divided by the square root of the sample size.
- 📉 The script highlights the uncertainty in estimating the true population mean and variance, emphasizing that these are estimates based on the sample.
- 📚 The final part of the script teases the calculation of a confidence interval, suggesting that the next video will cover how to estimate the range within which the true population mean is likely to fall with a certain level of confidence.
Q & A
What is the context of the presidential election scenario described in the script?
-The context is a hypothetical scenario where there are two candidates in a presidential election, and the population is 100 million. Every eligible voter will cast a vote for either candidate A or candidate B.
What is the significance of the variable 'p' in this scenario?
-The variable 'p' represents the percentage of the population that is expected to vote for candidate B. It is a key parameter in the Bernoulli distribution used to model the voting outcomes.
Why is it not feasible to survey all 100 million people?
-It is practically impossible to survey all 100 million people due to the sheer size of the population and the resources required for such a large-scale survey.
What is the purpose of conducting a random survey in this scenario?
-The purpose of conducting a random survey is to estimate the value of 'p', which represents the proportion of the population that will vote for candidate B.
How many people are sampled in the random survey described in the script?
-In the script, a random survey of 100 people is conducted to estimate the voting preferences.
What is the sample mean calculated from the survey results?
-The sample mean is calculated as 0.43, which is derived from 57 people voting for candidate A (0s) and 43 people voting for candidate B (1s), divided by the total number of samples (100).
What is the sample variance calculated from the survey results?
-The sample variance is calculated to be 0.2475, which is determined by the squared distances of each sample from the mean, divided by the number of samples minus one (99).
How is the sample standard deviation related to the sample variance?
-The sample standard deviation is the square root of the sample variance. In this case, it is approximately 0.50 or 50%.
What is the concept of a sampling distribution of the sample mean?
-The sampling distribution of the sample mean is the distribution that would result if we were to take many samples from the population and calculate the mean of each sample. It helps us understand the variability of sample means.
Why is the standard deviation of the sampling distribution of the sample mean divided by the square root of the sample size?
-The division by the square root of the sample size is a mathematical property that relates the standard deviation of the population to the standard deviation of the sample means, reflecting the reduction in variability as sample size increases.
How can we estimate the standard deviation of the population from the sample?
-We can estimate the standard deviation of the population by using the sample standard deviation as our best estimate and then dividing it by the square root of the sample size.
What is the purpose of finding a confidence interval for the sample mean?
-The purpose of finding a confidence interval is to provide a range around the sample mean within which we can be reasonably confident (e.g., 95% sure) that the true population mean lies.
How does the estimated standard deviation of the sampling distribution of the sample mean affect the width of the confidence interval?
-A smaller estimated standard deviation will result in a narrower confidence interval, indicating greater precision in our estimate. Conversely, a larger standard deviation will result in a wider interval.
Outlines
🗳️ Presidential Election and Bernoulli Distribution
The script begins with a hypothetical scenario set in a country of 100 million people with an upcoming presidential election featuring two candidates, A and B. The narrator introduces the concept of a Bernoulli Distribution to model the binary outcome of voters choosing either candidate A (represented as 0) or candidate B (represented as 1). The mean of this distribution is highlighted as 'p', which represents the probability that a voter will choose candidate B. The challenge of determining the exact value of 'p' is discussed, as it would require surveying the entire population, which is impractical. Instead, the narrator proposes using a random sample to estimate 'p' and assess the quality of this estimate.
📊 Calculating Sample Mean and Variance
This paragraph delves into the specifics of conducting a random survey and calculating the sample mean and variance based on the responses. The narrator provides an example where 57 out of 100 surveyed individuals indicate they would vote for candidate A, and 43 for candidate B. The sample mean is calculated by taking the average of the 0's (for A) and 1's (for B), resulting in 0.43. The sample variance is then computed using the formula that involves the squared distances of each sample point from the mean, divided by the sample size minus one, yielding a variance of 0.2475. The sample standard deviation is derived from the variance, which is approximately 0.50. The narrator emphasizes the importance of these statistics in estimating the true population parameters.
📉 Estimating Confidence Intervals for Population Proportion
The final paragraph focuses on the concept of confidence intervals and how they can be used to estimate the true population mean (or proportion of votes for candidate B) with a certain level of confidence. The narrator explains that the sampling distribution of the sample mean is derived from the population distribution and that its mean (mu sub x-bar) is equal to the population mean (mu), which is 'p'. The standard deviation of the sampling distribution is calculated by dividing the population standard deviation by the square root of the sample size. Since the true population standard deviation is unknown, the sample standard deviation is used as an estimate. The narrator then discusses the process of creating a confidence interval around the sample mean, using the estimated standard deviation and a 95% confidence level, to assert that there is a high probability that the true population mean lies within this interval. The video concludes with a pause for reflection on the concepts covered and a teaser for the next video, which will continue the discussion on confidence intervals.
Mindmap
Keywords
💡Presidential Election
💡Candidates A and B
💡Bernoulli Distribution
💡Mean
💡Sample
💡Sample Mean
💡Sample Variance
💡Sample Standard Deviation
💡Confidence Interval
💡Sampling Distribution
Highlights
A presidential election scenario with two candidates is presented to illustrate a Bernoulli Distribution.
The concept of p percent voting for candidate B and (1-p) percent for candidate A is introduced.
The mean of the Bernoulli Distribution is established as being equal to p.
The challenge of estimating the true mean (p) in a population of 100 million without surveying everyone is discussed.
A random survey of 100 people is proposed as a method to estimate p.
The results of the survey, with 57 voting for candidate A and 43 for candidate B, are given.
Calculation of the sample mean, resulting in 0.43, is demonstrated.
The process of calculating the sample variance is explained, with a focus on squared distances from the mean.
The sample variance is calculated to be 0.2475, using the formula and a calculator.
The sample standard deviation is derived as the square root of the sample variance, approximately 0.50.
The importance of the sample mean as an estimate for the percentage of people voting for each candidate is emphasized.
The concept of a confidence interval is introduced to gauge the accuracy of the sample as an estimator.
The standard deviation of the sampling distribution of the sample mean is discussed, highlighting its dependence on the population standard deviation and sample size.
An estimate for the standard deviation of the sampling distribution is calculated using the sample standard deviation.
The video pauses to prompt viewers to consider how to find a 95% confidence interval based on the information provided.
The video concludes with a teaser for the next part, which will cover calculating the confidence interval.
Transcripts
Browse More Related Video

Confidence interval example | Inferential statistics | Probability and Statistics | Khan Academy
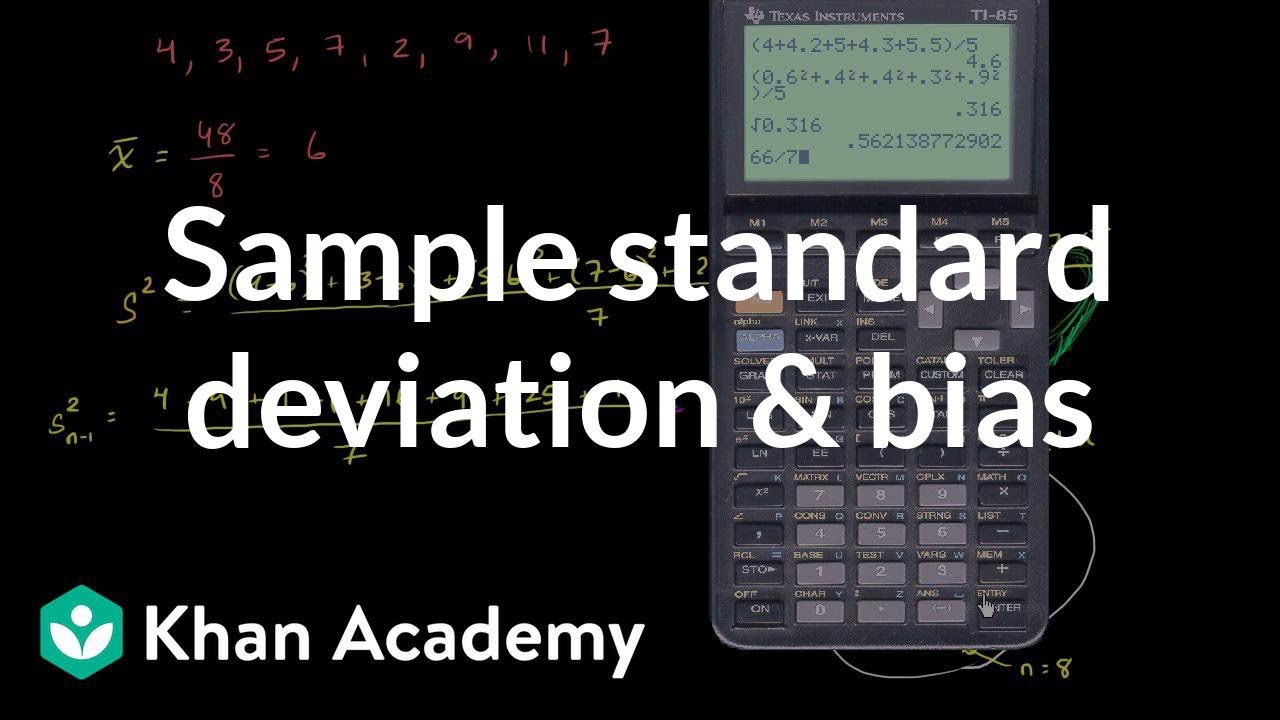
Sample standard deviation and bias | Probability and Statistics | Khan Academy
Sample variance | Descriptive statistics | Probability and Statistics | Khan Academy
Introduction to sampling distributions | Sampling distributions | AP Statistics | Khan Academy
Sample Mean and Population Mean - Statistics

Confidence Interval for a population proportion | Solved Problems
5.0 / 5 (0 votes)
Thanks for rating: