Introduction to sampling distributions | Sampling distributions | AP Statistics | Khan Academy
TLDRThe video script introduces the concept of a sampling distribution, using a hypothetical population of numbered balls to illustrate how population parameters like the mean or standard deviation can be estimated through sample statistics. It explains that since samples are random, the calculated statistics vary, leading to a distribution of possible values. A detailed example is provided, showing how different samples of two balls each can result in various sample means, and these are then plotted to form a sampling distribution, highlighting the frequencies of obtaining certain sample means.
Takeaways
- 📊 A sampling distribution represents the distribution of values obtained from a statistic calculated over numerous random samples of a given population.
- 🎯 The concept is used to estimate population parameters when the true value is unknown or difficult to find.
- 🔢 Population parameters include the population mean, standard deviation, and proportions, which are considered 'truths' about the population.
- ⚖️ To estimate a population parameter, a sample is taken and a statistic is calculated from it.
- 🔄 The process of sampling with replacement ensures that each selection is independent, allowing for a variety of possible sample means.
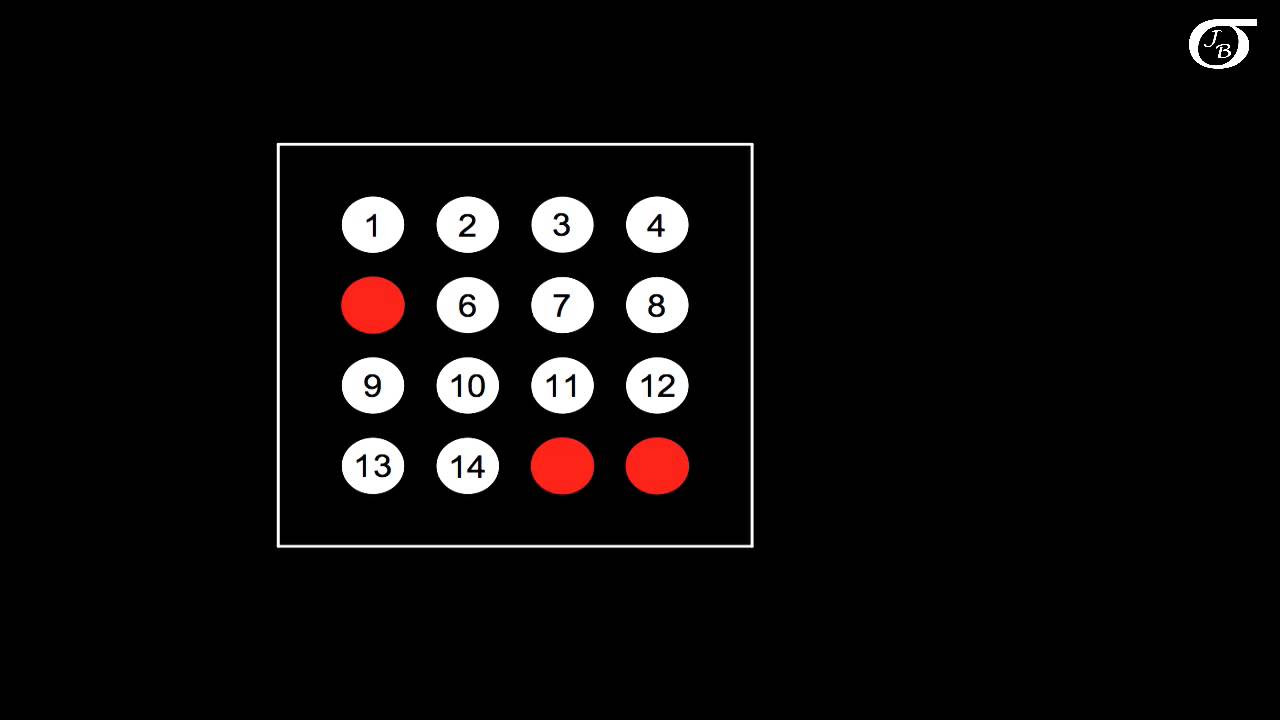
- 🏓 The example given in the script involves a population of three balls, each with a number (1, 2, or 3), and the population mean is calculated as 2.
- 🎰 Samples of two balls are taken with replacement to estimate the population mean, resulting in different sample means such as 1, 1.5, 2, 2.5, or 3.
- 📈 The frequencies of these sample means can be plotted to form a sampling distribution graph, showing the relative likelihood of each possible sample mean.
- 🧩 The script provides a detailed example with a table and a graph to illustrate the concept, including the calculation of sample means and their corresponding frequencies.
- 🔍 By understanding the sampling distribution, one can assess the probability of obtaining certain sample means and thus make inferences about the population parameter.
Q & A
What is the main concept discussed in the video?
-The main concept discussed in the video is the idea of a sampling distribution and how it relates to estimating population parameters from sample statistics.
What are some examples of population parameters?
-Examples of population parameters include the population mean, population standard deviation, and the proportion of a certain characteristic within the population.
Why might it be difficult to find the exact population parameter?
-It might be difficult to find the exact population parameter because populations are often large, and it is not always practical or possible to collect data from every single member of the population.
How can we estimate a population parameter if we cannot measure it directly?
-We can estimate a population parameter by taking a random sample from the population and calculating a statistic from that sample, which is used as an estimate for the population parameter.
What is the difference between a sample and a population in this context?
-A population is the entire group of individuals or items being studied, while a sample is a smaller subset of the population that is used to represent and make inferences about the whole population.
What is the purpose of a sampling distribution?
-The purpose of a sampling distribution is to show the frequency and range of possible values for a statistic as it is calculated from different random samples of the same population, helping to understand the variability and accuracy of the sample-based estimates.
How does the video example illustrate the concept of a sampling distribution?
-The video example uses a simple population of three numbered balls and demonstrates how different samples of two balls can result in different sample means. It then shows how these sample means can be plotted to create a sampling distribution of the sample means.
What is the population mean in the video example?
-In the video example, the population mean is calculated as (1 + 2 + 3) / 3, which equals 2.
How does the sampling distribution of the sample mean change as the sample size increases?
-As the sample size increases, the shape of the sampling distribution of the sample mean tends to become more symmetric and bell-shaped, according to the central limit theorem. This also results in a decrease in the standard error and a more accurate estimate of the population mean.
What is the central limit theorem mentioned in the video?
-The central limit theorem is a statistical theory that states that the sampling distribution of the sample mean will approach a normal distribution, or a bell curve, as the sample size becomes larger, regardless of the shape of the original population distribution.
How can we use the sampling distribution to make inferences about the population?
-We can use the sampling distribution to estimate the likelihood of observing certain sample statistics, which in turn allows us to make inferences about the population parameters. This is the basis of statistical inference, where we use sample data to draw conclusions about the larger population.
Outlines
📊 Introduction to Sampling Distribution
This paragraph introduces the concept of a sampling distribution in the context of statistical analysis. The instructor uses an illustrative example of a population of balls with numbers written on them to explain how population parameters such as mean, standard deviation, and proportions can be estimated through sampling. The key points discussed include the definition of a sampling distribution, the process of taking a sample (with replacement in this case), and how the statistics calculated from different samples can vary. The paragraph sets the stage for a deeper exploration of how these variations form a distribution that can be used to estimate population parameters.
🎯 Calculating Frequencies in Sampling Distribution
The second paragraph delves into the specifics of calculating the frequencies of different sample means within a sampling distribution. The instructor continues with the ball example, this time focusing on the outcomes when sampling two balls at a time with replacement. The main points include the identification of all possible combinations of sample means (1, 1.5, 2, 2.5, 3) and the calculation of their relative frequencies (1/9, 2/9, 3/9, 2/9, 1/9). The paragraph explains how these frequencies can be visually represented, leading to the construction of a sampling distribution graph for sample size n equals two. This distribution provides insight into the likelihood of obtaining various sample means and is crucial for understanding how to estimate population parameters from sample data.
Mindmap
Keywords
💡Sampling Distribution
💡Population
💡Sample
💡Parameter
💡Sample Mean
💡Sample Size
💡Population Mean
💡Estimate
💡Frequency
💡Random Sample
💡With Replacement
Highlights
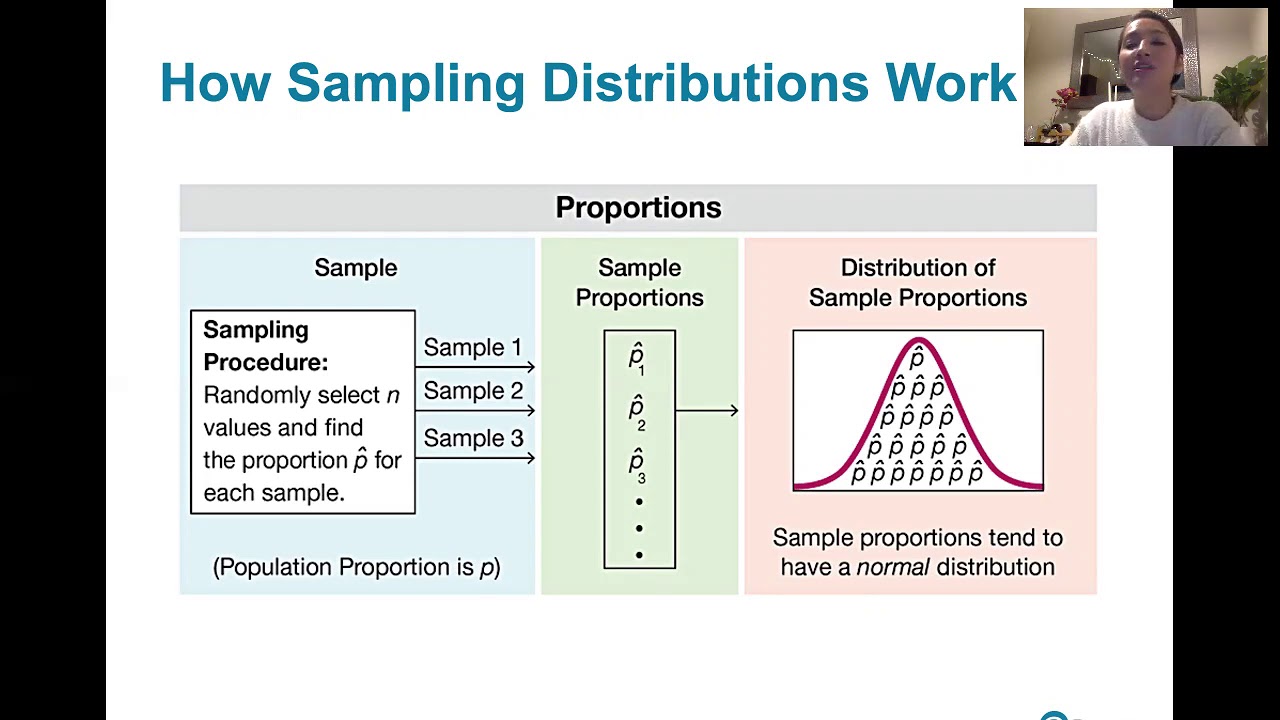
The concept of a sampling distribution is introduced to understand the distribution of values obtained from estimating a population parameter.
A population is described as a group of entities (e.g., balls with numbers) from which parameters like mean or standard deviation can be calculated.
Parameters are considered as truths about a population, such as the population mean or the proportion of even numbers.
Estimating a population parameter involves taking a sample and calculating a statistic from it.
The process of sampling introduces randomness, meaning that the calculated statistic may not match the population parameter exactly.
A sampling distribution shows the frequency of different values that a statistic can take when multiple samples are drawn from the population.
The example given involves a simple population of three balls, numbered one, two, and three, with a population mean of two.
Samples of two balls are taken with replacement to estimate the population mean, resulting in different sample means.
The possible sample means and their frequencies form the sampling distribution, which can be visualized in a table and a graph.
The table lists all possible combinations of two balls that can be picked and their corresponding sample means.
The graph represents the sampling distribution by plotting the possible sample means against their frequencies.
The relative frequency of obtaining a sample mean of one is 1/9, indicating the probability of this outcome.
A sample mean of 1.5 has a relative frequency of 2/9, showing its likelihood in the sampling distribution.
The most frequent sample mean is two, occurring 3 times out of 9 samples, or with a probability of 1/3.
A sample mean of 2.5 has a relative frequency of 2/9, similar to the sample mean of 1.5.
The least frequent sample means are one and three, each occurring only once out of nine samples, with a relative frequency of 1/9.
The sampling distribution for a sample size of two demonstrates the variability in estimating the population mean through different samples.
Transcripts
Browse More Related Video
Sampling Distributions: Introduction to the Concept
02 - What is the Central Limit Theorem in Statistics? - Part 1
SAMPLING DISTRIBUTION OF SAMPLE MEANS - WITH AND WITHOUT REPLACEMENT

WHAT IS A "SAMPLING DISTRIBUTION" and how is it different from a "sample distribution"... and stuff
6.3.1 Sampling Distributions and Estimators - Sampling Distributions Described and Defined
What is a Sampling Distribution? | Puppet Master of Statistics
5.0 / 5 (0 votes)
Thanks for rating: