Sample standard deviation and bias | Probability and Statistics | Khan Academy
TLDRThe video script discusses a hypothetical scenario where a watermelon farmer aims to study the seed density in watermelons without damaging the entire crop. The farmer takes a sample of eight cubic inch chunks from randomly selected watermelons and counts the seeds within each. The script then delves into statistical analysis, calculating the sample mean to estimate the population mean, which is found to be 6 seeds per cubic inch. To understand the variation within the population, the unbiased sample variance is calculated, resulting in approximately 9.43 when divided by the sample size minus one (7). The script further explains how taking the square root of this unbiased sample variance gives an estimate of the population standard deviation, which is approximately 3.07. However, it is noted that this method introduces bias when estimating the true population standard deviation due to the nonlinear nature of the square root function. Despite this, the script concludes that this approach remains the simplest and most widely used tool for estimating population standard deviation in statistical analysis.
Takeaways
- 🍉 **Seed Density Study**: The farmer aims to study seed density without cutting open every watermelon, focusing on breeding watermelons with fewer seeds.
- 📝 **Sampling Method**: Instead of examining the entire population, a random sample of watermelon chunks is used to estimate seed density.
- 🔢 **Sample Mean Calculation**: The sample mean is calculated by summing the number of seeds in the samples and dividing by the number of samples (8 in this case), resulting in a mean of 6 seeds.
- 📊 **Variance and Standard Deviation**: The script discusses the importance of estimating the population variance and standard deviation from the sample data.
- ➗ **Unbiased Sample Variance**: An unbiased sample variance is calculated by dividing the sum of squared differences from the mean by the sample size minus one (n-1), resulting in approximately 9.43.
- √ **Sample Standard Deviation**: The sample standard deviation is the square root of the unbiased sample variance, which is approximately 3.07.
- 🤔 **Bias in Estimation**: The square root transformation introduces bias when estimating the population standard deviation from the sample standard deviation.
- 🧮 **Nonlinear Transformation**: The script highlights that because the square root function is nonlinear, taking the square root of the unbiased sample variance does not yield an unbiased estimate of the population standard deviation.
- 🔍 **Simulation Suggestion**: The speaker encourages conducting simulations to understand the bias introduced by taking the square root of the sample variance.
- 📐 **Statistical Tools**: Despite the bias, the square root of the unbiased sample variance is used as the standard method for estimating the population standard deviation due to its simplicity and utility.
- ⚖️ **Balance Between Bias and Utility**: The script emphasizes the trade-off between using an unbiased but complex method versus a simpler method that may introduce some bias.
Q & A
What is the primary goal of the watermelon farmer in the given scenario?
-The primary goal of the watermelon farmer is to study the seed density in their watermelons with the aim of breeding watermelons that have fewer seeds over time, without having to cut open every watermelon they intend to sell.
What is the sample size (n) used by the farmer in this scenario?
-The sample size (n) used by the farmer is 8, which refers to the number of cubic inch chunks taken from the watermelons for seed density analysis.
What does the sample mean represent in this context?
-The sample mean represents an estimate of the population mean, which is the average number of seeds per cubic inch in the entire watermelon farm.
How is the sample mean calculated?
-The sample mean is calculated by adding up all the seed counts from the sampled chunks and then dividing by the number of samples (n).
What is the sample mean of the seed counts in the given scenario?
-The sample mean of the seed counts is 6, which is the sum of all seed counts (48) divided by the number of samples (8).
Why is the sample variance calculated using n-1 instead of n?
-The sample variance is calculated using n-1 (where n is the sample size) to provide an unbiased estimate of the population variance, especially when the population standard deviation is unknown.
What is the unbiased sample variance calculated in the scenario?
-The unbiased sample variance is approximately 9.43, calculated by summing the squared differences between each seed count and the sample mean, then dividing by n-1 (which is 7 in this case).
How is the sample standard deviation derived from the sample variance?
-The sample standard deviation is derived from the sample variance by taking the square root of the unbiased sample variance.
What is the approximate sample standard deviation in the given scenario?
-The approximate sample standard deviation is about 3.07, which is the square root of the unbiased sample variance (9.43).
Why is the sample standard deviation obtained from the square root of the unbiased sample variance considered biased?
-The sample standard deviation is considered biased because the square root function is nonlinear, and taking the square root of an unbiased estimate does not necessarily result in an unbiased estimate of the population standard deviation.
What is the counterintuitive aspect mentioned about the sample standard deviation?
-The counterintuitive aspect is that despite using n-1 to calculate an unbiased sample variance, taking the square root of this variance does not yield an unbiased estimate of the population standard deviation due to the nonlinearity of the square root function.
Why is the method used for the sample standard deviation the simplest and best tool available, despite it being biased?
-The method is the simplest and best tool available because it is straightforward to calculate and widely understood. While it is biased, it provides a practical and useful estimate for the population standard deviation in the absence of a more straightforward unbiased alternative.
Outlines
🍉 Watermelon Seed Density Study
This paragraph discusses a hypothetical scenario where a watermelon farmer is interested in studying the seed density of their watermelons to breed varieties with fewer seeds. Instead of cutting open every watermelon, the farmer takes a sample of eight cubic inch chunks from a random selection of watermelons and counts the seeds within each. The paragraph then delves into statistical analysis to estimate the population mean and variance. The sample mean is calculated by summing the seed counts and dividing by the number of samples, resulting in a mean of 6 seeds per cubic inch. The unbiased sample variance is also computed, taking into account the smaller sample size by dividing by the number of samples minus one, which in this case is 7. The calculation yields an unbiased sample variance of approximately 9.43.
📊 Estimating Population Standard Deviation
The second paragraph continues the statistical analysis by addressing how to calculate the sample standard deviation as an estimate for the population standard deviation. It explains that while taking the square root of the unbiased sample variance is a logical step, this method actually results in a biased estimate of the true population standard deviation due to the nonlinear nature of the square root function. The paragraph acknowledges the counterintuitive nature of this finding and suggests that simulations can be used to further understand this concept. It also touches on the difficulty of finding an unbiased estimate for the population standard deviation, as it depends on the specific distribution of the population. The standard deviation is calculated to be approximately 3.07, and while it is not an unbiased estimate, it is considered the simplest and most practical tool for this purpose.
Mindmap
Keywords
💡Watermelon farmer
💡Seed density
💡Sampling
💡Population mean
💡Sample mean
💡Population variance
💡Sample variance
💡Unbiased sample variance
💡Sample standard deviation
💡Central tendency
💡Nonlinear function
Highlights
The farmer wants to study the seed density in watermelons to breed varieties with fewer seeds.
A random sample of watermelons is taken to estimate seed density without cutting open every one.
The farmer takes 8 cubic inch samples from the watermelons and counts the seeds.
The sample mean is calculated by adding the seed counts and dividing by the number of samples.
The sample mean of 6 seeds is obtained, providing an estimate of the population mean.
The unbiased sample variance is calculated to estimate the population variance.
Dividing by n-1 instead of n provides an unbiased estimate of the population variance.
The unbiased sample variance is calculated as the sum of squared differences from the mean, divided by 7.
The unbiased sample variance is approximately 9.43.
The sample standard deviation is estimated by taking the square root of the unbiased sample variance.
The sample standard deviation is approximately 3.07.
Taking the square root of the sample variance actually gives a biased estimate of the population standard deviation.
The bias arises because the square root function is nonlinear.
There is no simple formula to obtain an unbiased estimate of the population standard deviation.
The standard deviation estimate depends on the distribution of the population.
The commonly used sample standard deviation is based on the square root of the unbiased sample variance.
While biased, this method provides the simplest and best estimate of the population standard deviation available.
Transcripts
Browse More Related Video
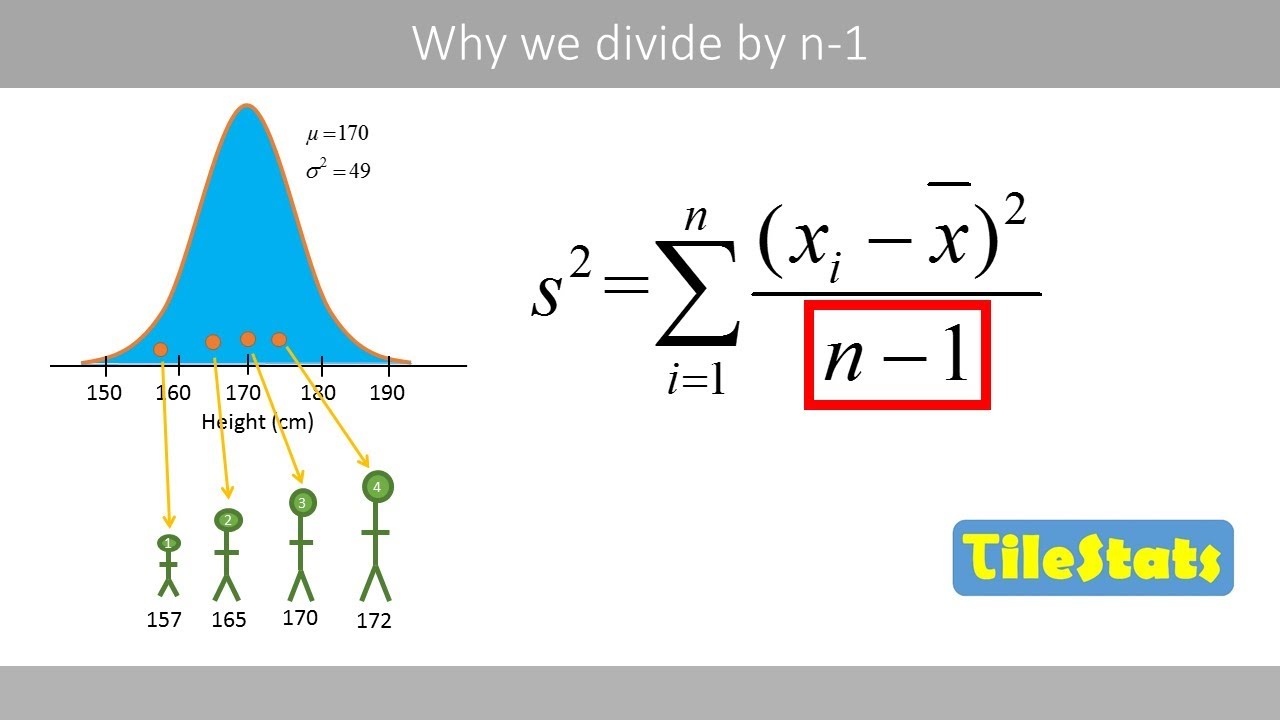
Why do we divide by n-1 and not n? | shown with a simple example | variance and sd
Standard Error of the Mean: Concept and Formula | Statistics Tutorial #6 | MarinStatsLectures
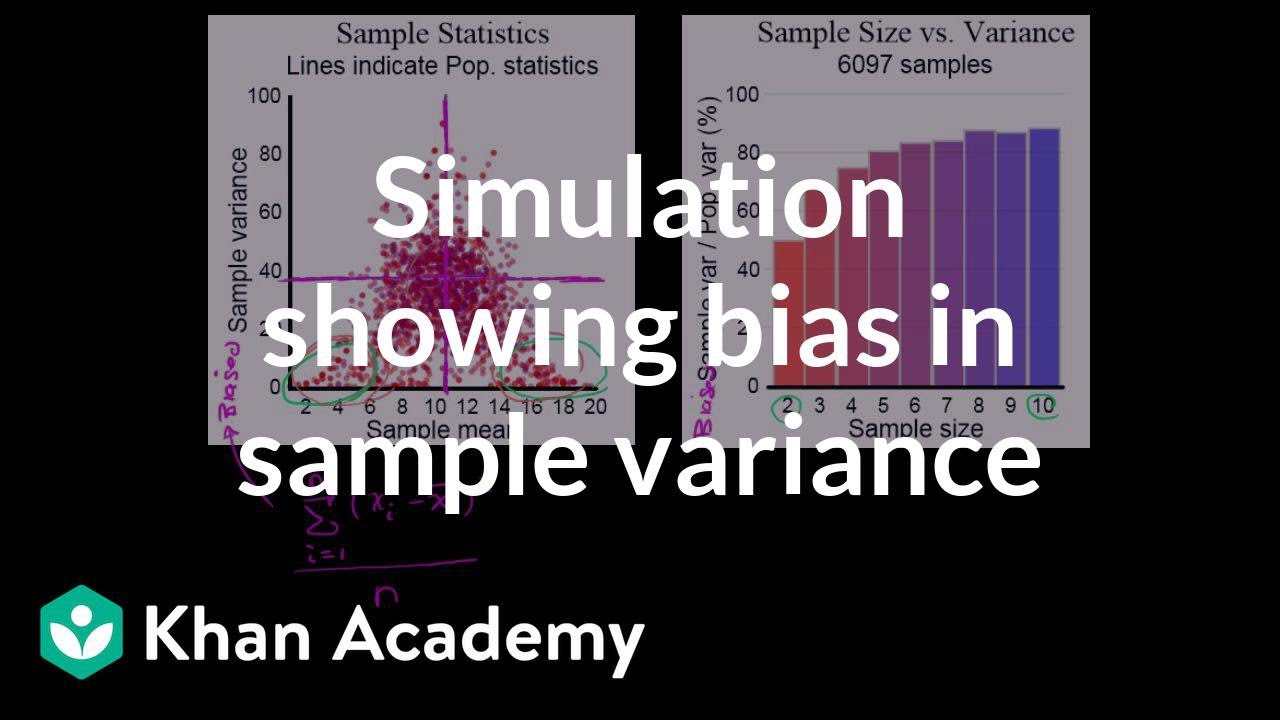
Simulation showing bias in sample variance | Probability and Statistics | Khan Academy
Simulation providing evidence that (n-1) gives us unbiased estimate | Khan Academy

Statistics: Standard deviation | Descriptive statistics | Probability and Statistics | Khan Academy
6.4.4 The Central Limit Theorem - Finite Population Correction Factor
5.0 / 5 (0 votes)
Thanks for rating: