Sample variance | Descriptive statistics | Probability and Statistics | Khan Academy
TLDRThe video script discusses the concept of estimating population parameters, specifically the mean and variance, through sampling. It explains the impracticality of surveying an entire population, such as the United States, and instead suggests using a sample to estimate these parameters. The script provides a detailed example of calculating the sample mean and variance, highlighting the difference between the sample variance calculated by dividing by the number of data points (n) and the more accurate method which divides by n minus 1. This latter approach is shown to provide a better estimate of the population variance, a concept that will be further explained in a subsequent video.
Takeaways
- 📊 Estimating population parameters like mean TV watching time is challenging due to large populations and data changes over time.
- 🔍 The theoretical population mean exists but is practically impossible to determine exactly.
- 🧠 Instead, we use samples to estimate population parameters, such as the mean hours of TV watched.
- 🔢 The sample mean (x̄) is calculated by summing all observations and dividing by the number of observations.
- 📈 To estimate the population variance, one would typically sum the squared differences from the mean and divide by the number of data points.
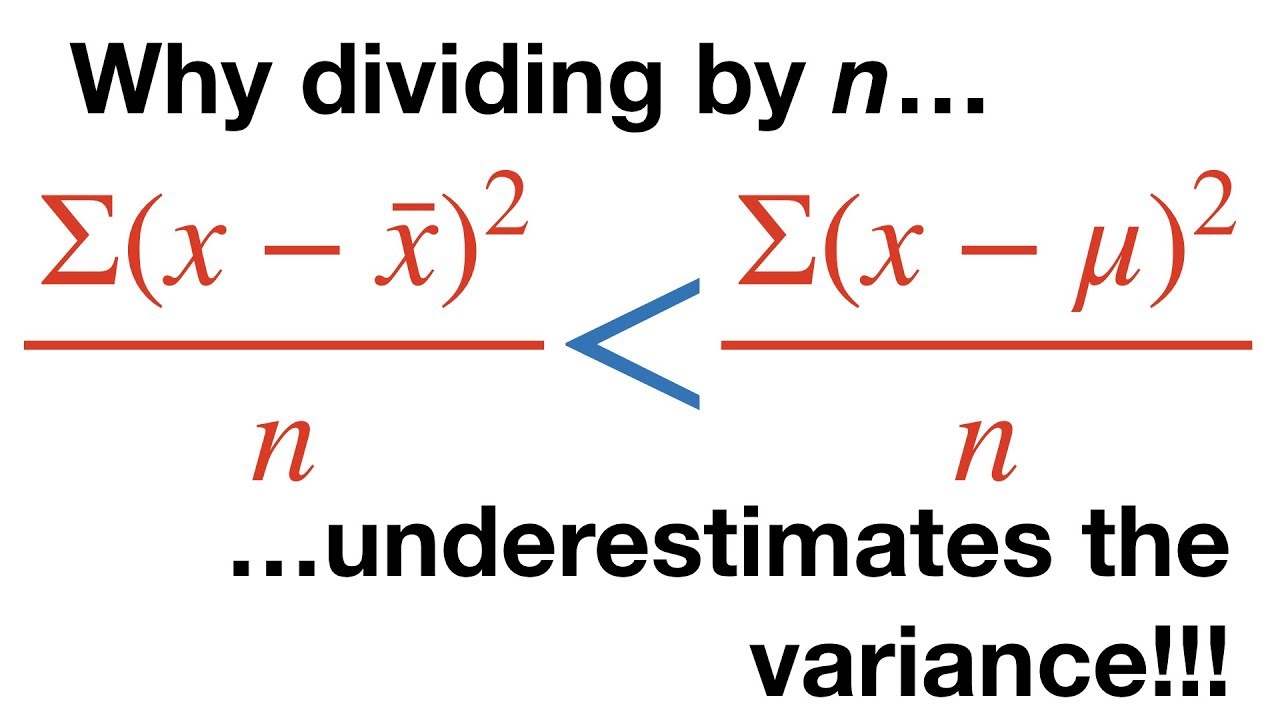
- 🤔 However, the above method for estimating variance may not be the best due to its bias towards underestimation.
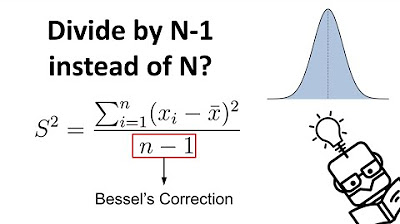
- 🎯 A better estimate for population variance is achieved by dividing the sum of squared differences by the number of data points minus one (n-1).
- 🌟 This adjusted calculation is known as the sample variance and provides a less biased estimate of the population variance.
- 💡 The reason for dividing by n-1 will be explained in subsequent content, offering more intuitive understanding.
- 🔄 The concept of sample variance is fundamental in statistics and is used to make inferences about population parameters from sample data.
- 🚀 The script hints at a future computer simulation to further validate the effectiveness of using n-1 for estimating population variance.
Q & A
What is the main topic of the transcript?
-The main topic of the transcript is understanding and estimating population parameters, specifically the population mean and variance, using sample data.
Why is it impractical to survey the entire population in a country to determine TV watching habits?
-It is impractical due to the large number of people, the time and resources required for such a survey, and the fact that data could become outdated quickly due to births, deaths, and other demographic changes.
What is the population mean in the context of the transcript?
-The population mean refers to the average number of hours of TV watched per day by every individual in the entire population, which is a theoretical value that is nearly impossible to determine exactly.
How is a sample mean calculated?
-The sample mean, denoted by x with a bar over it, is calculated by summing all the data points in the sample and then dividing by the number of data points in the sample.
What are the steps to estimate the population variance using a sample?
-To estimate the population variance, you take each data point in the sample, find the difference between that point and the sample mean, square that difference, sum up all the squared differences, and then divide by the number of data points in the sample.
What is the formula for calculating the sample variance?
-The sample variance is calculated by taking the sum of the squared differences between each data point and the sample mean, and then dividing by the number of data points in the sample (n).
Why might the initial calculation of sample variance not be the best estimate for the population variance?
-The initial calculation might underestimate the population variance because it does not account for the variability that would be present in the entire population. This is why dividing by n-1 (one less than the number of data points) provides a better estimate.
What is the standard definition of sample variance?
-The standard definition of sample variance involves taking the sum of the squared differences between each data point and the sample mean, and then dividing by n-1 (the number of data points minus one).
Why is dividing by n-1 in the calculation of sample variance considered better for estimating the population variance?
-Dividing by n-1 gives a better estimate of the population variance because it accounts for the fact that the sample mean is an estimate and not the true population mean. This adjustment provides an unbiased estimate of the population variance.
How does the concept of sample size affect the estimation of population parameters?
-The concept of sample size is crucial because as the sample size increases, the sample mean and variance become more reliable estimates of the population parameters. A larger sample size reduces sampling error and provides a more accurate representation of the population.
What is the purpose of using sample statistics like mean and variance in statistics?
-The purpose of using sample statistics is to make inferences about the population parameters when it is impractical or impossible to collect data from the entire population. Sample statistics serve as estimates that help us understand the population's characteristics.
How can we improve our estimate of the population variance?
-We can improve our estimate of the population variance by using a larger sample size and by applying the correct formula for sample variance (dividing by n-1), which accounts for the sample's representativeness of the population.
Outlines
📊 Estimating Population Mean and Variance
This paragraph discusses the impracticality of surveying an entire population, such as the United States, to determine the average hours of TV watched per day. It explains that while the theoretical population mean exists, it is nearly impossible to ascertain due to factors like population changes. Instead, a sample is taken to estimate the population mean. The process of calculating the sample mean is detailed, where individuals' TV watching hours are summed and divided by the sample size. The paragraph further explores the concept of estimating the population variance using the same sample, highlighting the challenge of obtaining an accurate estimate without complete population data.
📈 Calculation and Estimation of Sample Variance
The paragraph delves into the methodology of estimating the population variance using a sample. It describes the process of calculating the sample variance by finding the squared differences between each data point and the sample mean, then dividing by the number of data points. The calculation is demonstrated with the given data points, resulting in an approximate variance of 1.08. The paragraph then poses a question about the accuracy of this estimate and hints at a better estimation method that will be explained in the next video, where the sample variance is calculated by dividing by one less than the number of data points.
🔢 Standard Definition of Sample Variance
This paragraph clarifies the standard definition of sample variance, contrasting it with the method previously discussed. It explains that the more accepted approach to calculating sample variance involves dividing the sum of squared differences by the number of data points minus one (n-1), rather than n. This technique is recognized as providing a better estimate of the population variance, although the rationale behind it is not fully explained here and is promised to be covered in the subsequent video.
Mindmap
Keywords
💡TV watching habits
💡Population mean
💡Sample mean
💡Population variance
💡Sample variance
💡Estimation
💡Data points
💡Sampling
💡Statistic
💡n minus 1
💡Unbiased estimate
Highlights
Exploring people's TV watching habits and the challenge of surveying a large population.
The concept of the population mean and its impracticality to measure exactly.
The use of sampling as a practical alternative to surveying entire populations.
Calculating the sample mean by summing hours of TV watched and dividing by the number of individuals.
The introduction of the population variance and its importance in understanding data distribution.
Estimating population variance using sample data and the steps involved in the process.
The formula for calculating population variance and its application to sample data.
The concept of sample variance and its role in estimating population variance.
The surprising result that dividing by n-1 in sample variance provides a better estimate than dividing by n.
The mathematical notation for calculating the standard definition of sample variance.
The预告 of an upcoming explanation to provide intuition for why dividing by n-1 is more effective.
The potential for a computer simulation to experimentally validate the estimation method.
The inherent limitations and challenges in estimating population parameters from sample data.
The importance of considering the theoretical truths in population statistics despite their inaccessibility.
The practical approach to statistical analysis when complete data is unattainable.
The illustration of statistical concepts through a relatable example of TV watching habits.
The discussion on the dynamic nature of population data and its impact on statistical analysis.
Transcripts
Browse More Related Video
Review and intuition why we divide by n-1 for the unbiased sample | Khan Academy
Calculating the Mean, Variance and Standard Deviation, Clearly Explained!!!
Another simulation giving evidence that (n-1) gives us an unbiased estimate of variance
Why We Divide by N-1 in the Sample Variance (Standard Deviation) Formula | The Bessel's Correction
Why Dividing By N Underestimates the Variance
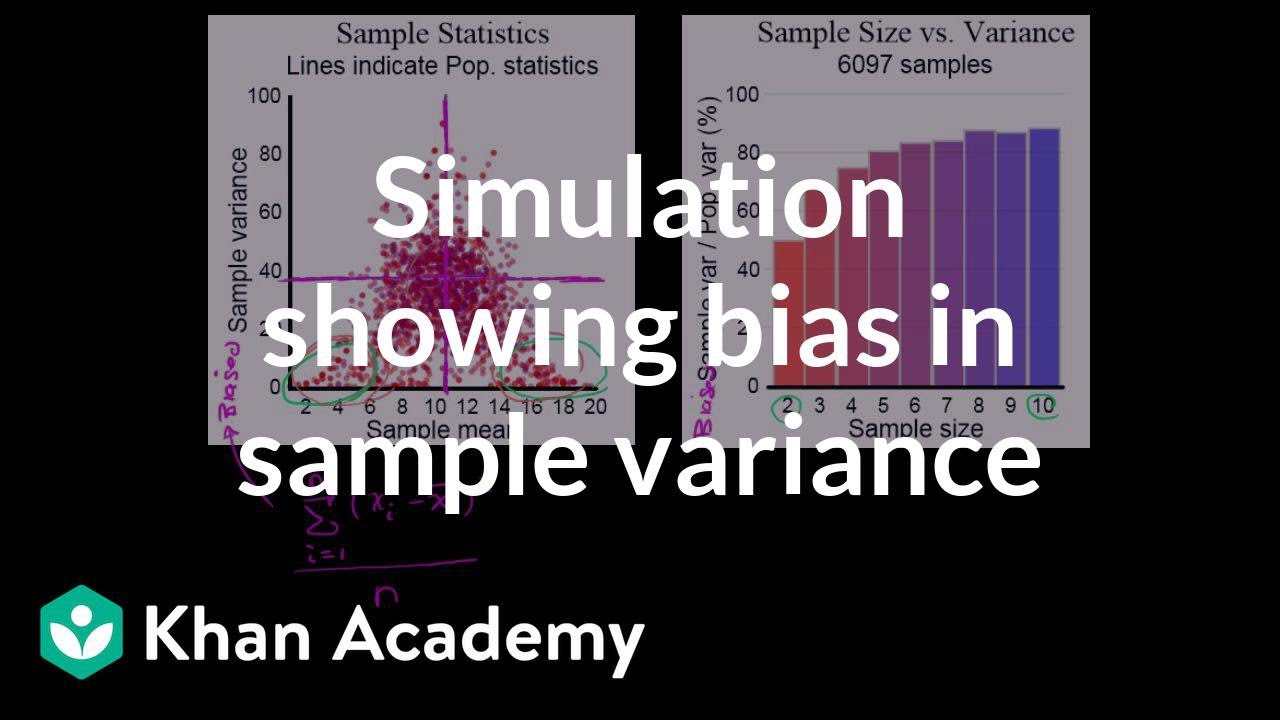
Simulation showing bias in sample variance | Probability and Statistics | Khan Academy
5.0 / 5 (0 votes)
Thanks for rating: